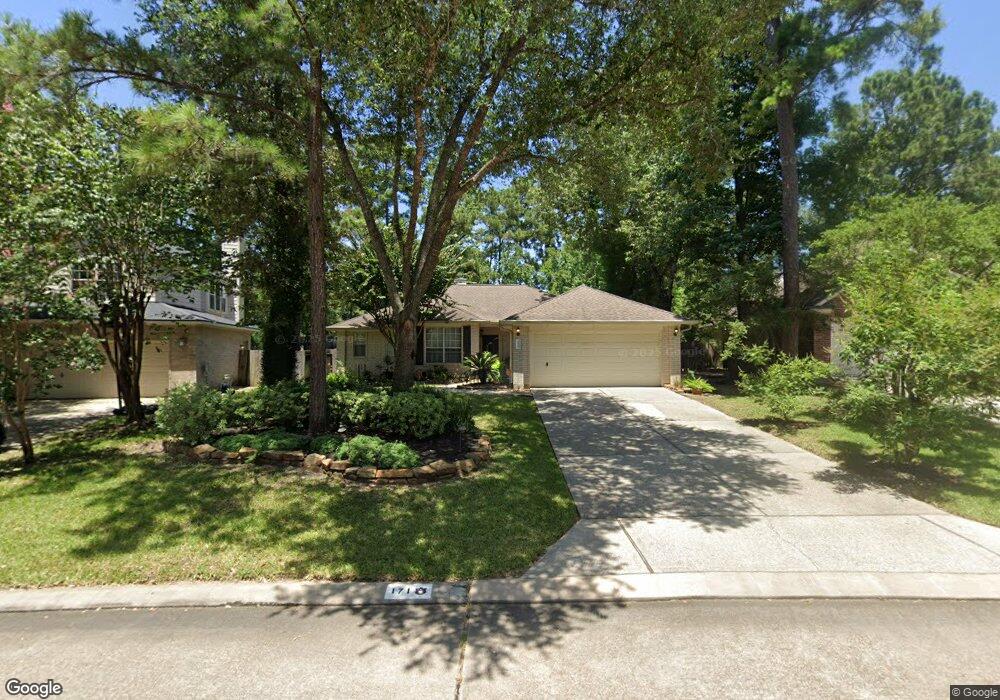
171 N Wynnoak Cir Spring, TX 77382
Alden Bridge NeighborhoodEstimated Value: $393,000 - $445,000
3
Beds
2
Baths
1,758
Sq Ft
$233/Sq Ft
Est. Value
About This Home
This home is located at 171 N Wynnoak Cir, Spring, TX 77382 and is currently estimated at $409,092, approximately $232 per square foot. 171 N Wynnoak Cir is a home located in Montgomery County with nearby schools including Buckalew Elementary School, Mitchell Intermediate School, and McCullough Junior High School.
Ownership History
Date
Name
Owned For
Owner Type
Purchase Details
Closed on
Mar 14, 2013
Sold by
Crider John E and Crider Elsa Cybelle
Bought by
Gilmore Annie
Current Estimated Value
Purchase Details
Closed on
Jul 29, 2010
Sold by
Rawlings Trevor W and Rawlings Nancy J
Bought by
Crider John E
Home Financials for this Owner
Home Financials are based on the most recent Mortgage that was taken out on this home.
Original Mortgage
$155,250
Interest Rate
4.76%
Mortgage Type
New Conventional
Purchase Details
Closed on
Jan 17, 2003
Sold by
Halliburton Real Estate Services Inc
Bought by
Rawlings Trevor W and Rawlings Nancy J
Home Financials for this Owner
Home Financials are based on the most recent Mortgage that was taken out on this home.
Original Mortgage
$156,750
Interest Rate
5.86%
Purchase Details
Closed on
Nov 5, 1999
Sold by
The Ryland Group Inc
Bought by
Rice Lloyd M and Rice Ginger L
Home Financials for this Owner
Home Financials are based on the most recent Mortgage that was taken out on this home.
Original Mortgage
$125,752
Interest Rate
7.73%
Mortgage Type
VA
Create a Home Valuation Report for This Property
The Home Valuation Report is an in-depth analysis detailing your home's value as well as a comparison with similar homes in the area
Home Values in the Area
Average Home Value in this Area
Purchase History
| Date | Buyer | Sale Price | Title Company |
|---|---|---|---|
| Gilmore Annie | -- | None Available | |
| Crider John E | -- | Ct | |
| Rawlings Trevor W | -- | First American Title | |
| Rice Lloyd M | -- | Cornerstone Title Co |
Source: Public Records
Mortgage History
| Date | Status | Borrower | Loan Amount |
|---|---|---|---|
| Previous Owner | Crider John E | $155,250 | |
| Previous Owner | Rawlings Trevor W | $156,750 | |
| Previous Owner | Rice Lloyd M | $125,752 |
Source: Public Records
Tax History Compared to Growth
Tax History
| Year | Tax Paid | Tax Assessment Tax Assessment Total Assessment is a certain percentage of the fair market value that is determined by local assessors to be the total taxable value of land and additions on the property. | Land | Improvement |
|---|---|---|---|---|
| 2025 | $4,234 | $393,270 | $60,000 | $333,270 |
| 2024 | $6,832 | $383,023 | $60,000 | $323,023 |
| 2023 | $6,832 | $371,990 | $60,000 | $311,990 |
| 2022 | $6,654 | $328,280 | $60,000 | $268,280 |
| 2021 | $5,789 | $265,420 | $28,720 | $236,700 |
| 2020 | $5,979 | $258,470 | $28,720 | $229,750 |
| 2019 | $6,203 | $259,880 | $28,720 | $231,160 |
| 2018 | $6,203 | $259,880 | $28,720 | $231,160 |
| 2017 | $5,633 | $233,160 | $28,720 | $204,440 |
| 2016 | $5,633 | $233,160 | $28,720 | $204,440 |
| 2015 | $5,338 | $237,270 | $28,720 | $208,550 |
| 2014 | $5,338 | $219,460 | $28,720 | $190,740 |
Source: Public Records
Map
Nearby Homes
- 147 N Wynnoak Cir
- 22 Almond Branch Place
- 66 N Brooksedge Cir
- 11 Lyreleaf Place
- 30 Lyreleaf Place
- 14 Wintergrass Place
- 23 Fortuneberry Place
- 171 W Sundance Cir
- 14 Broadweather Place
- 2 Sweet Birch Place
- 413 New Forest Ln
- 81 N Apple Springs Cir
- 33319 Lago Vista
- 35 Dewdrift Place
- 3 Broadweather Place
- 14 Redland Place
- 15 Redland Place
- 70 Harvest Wind Place
- 309 Gotland Russ Ln
- 349 Kerry Bog Ln
- 167 N Wynnoak Cir
- 175 N Wynnoak Cir
- 163 N Wynnoak Cir
- 179 Shale Run Place
- 166 N Wynnoak Cir
- 159 N Wynnoak Cir
- 174 N Wynnoak Cir
- 187 Shale Run Place
- 162 N Wynnoak Cir
- 155 N Wynnoak Cir
- 206 N Wynnoak Cir
- 6 Almond Branch Place
- 154 N Wynnoak Cir
- 191 Shale Run Place
- 207 Shale Run Place
- 210 N Wynnoak Cir
- 10 Almond Branch Place
- 2 Almond Branch Place
- 150 N Wynnoak Cir
- 203 Shale Run Place