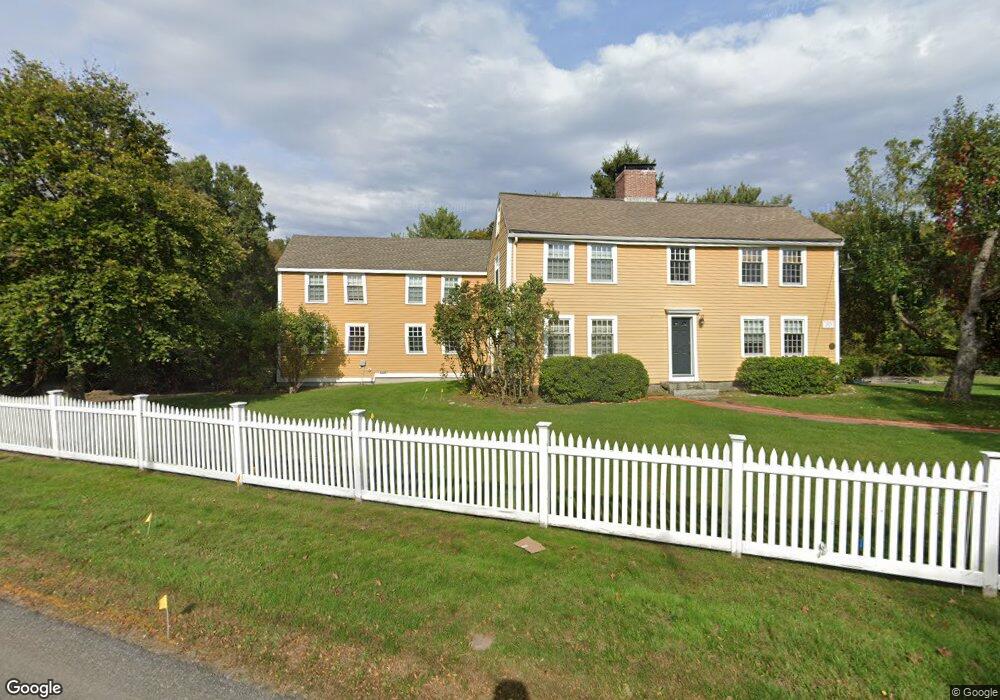
171 North Ave Unit 1 Weston, MA 02493
Estimated Value: $1,318,000 - $1,876,000
2
Beds
2
Baths
1,911
Sq Ft
$869/Sq Ft
Est. Value
About This Home
This home is located at 171 North Ave Unit 1, Weston, MA 02493 and is currently estimated at $1,660,333, approximately $868 per square foot. 171 North Ave Unit 1 is a home located in Middlesex County with nearby schools including Country Elementary School, Woodland Elementary School, and Weston Middle School.
Ownership History
Date
Name
Owned For
Owner Type
Purchase Details
Closed on
Jan 24, 2024
Sold by
Oettinger Marjorie
Bought by
Marjorie A Oettinger Ret and Oettinger
Current Estimated Value
Purchase Details
Closed on
Sep 30, 1998
Sold by
Roan James and Delrossi Laura
Bought by
Caliguri Brezinski-Caliguri D and Caliguri Edward J
Purchase Details
Closed on
Aug 25, 1995
Sold by
Muller Carolyn E and Muller Henry W
Bought by
Roan James and Delrossi Laura
Create a Home Valuation Report for This Property
The Home Valuation Report is an in-depth analysis detailing your home's value as well as a comparison with similar homes in the area
Home Values in the Area
Average Home Value in this Area
Purchase History
| Date | Buyer | Sale Price | Title Company |
|---|---|---|---|
| Marjorie A Oettinger Ret | -- | None Available | |
| Caliguri Brezinski-Caliguri D | $375,000 | -- | |
| Roan James | $365,000 | -- | |
| Roan James | $365,000 | -- |
Source: Public Records
Mortgage History
| Date | Status | Borrower | Loan Amount |
|---|---|---|---|
| Previous Owner | Roan James | $393,000 | |
| Previous Owner | Roan James | $80,000 |
Source: Public Records
Tax History Compared to Growth
Tax History
| Year | Tax Paid | Tax Assessment Tax Assessment Total Assessment is a certain percentage of the fair market value that is determined by local assessors to be the total taxable value of land and additions on the property. | Land | Improvement |
|---|---|---|---|---|
| 2025 | $15,125 | $1,362,600 | $567,200 | $795,400 |
| 2024 | $14,745 | $1,326,000 | $567,200 | $758,800 |
| 2023 | $14,258 | $1,204,200 | $567,200 | $637,000 |
| 2022 | $13,818 | $1,078,700 | $531,500 | $547,200 |
| 2021 | $0 | $941,000 | $419,400 | $521,600 |
| 2020 | $11,683 | $910,600 | $419,400 | $491,200 |
| 2019 | $11,096 | $881,300 | $395,700 | $485,600 |
| 2018 | $9,088 | $881,300 | $395,700 | $485,600 |
| 2017 | $10,928 | $881,300 | $395,700 | $485,600 |
| 2016 | $10,717 | $881,300 | $395,700 | $485,600 |
| 2015 | $10,409 | $847,600 | $376,900 | $470,700 |
Source: Public Records
Map
Nearby Homes
- 15 Whitney Tavern Rd
- 6 Overlook Dr
- 17 Lexington St
- 120 Church St
- 11 Winthrop Cir
- 3 October Ln
- 167 Conant Rd
- 51 Willard Rd
- 51 Church St
- 202 Bear Hill Rd
- 416 Conant Rd
- 5 Peakes Ln
- 426 Conant Rd
- 1 Aberdeen Rd
- 75 Westland Rd
- 60 Rolling Ln
- 8 Jericho Rd Unit 8
- 24 Jericho Rd Unit 24
- 6 Clifford Ln
- 121 Cherry Brook Rd
- 171 North Ave
- 171 North Ave
- 12 Whitney Tavern Rd
- 176 North Ave
- 170 North Ave
- 163 North Ave
- 166 North Ave
- 26 Whitney Tavern Rd
- 160 North Ave
- 191 North Ave
- 147 North Ave
- 189 North Ave
- 36 Whitney Tavern Rd
- 153 North Ave
- 190 North Ave
- 199 North Ave
- 158 North Ave
- 25 Whitney Tavern Rd
- 75 Sperry Ln (Lot 7 )
- 20 Sperry Lane (Lot 16)