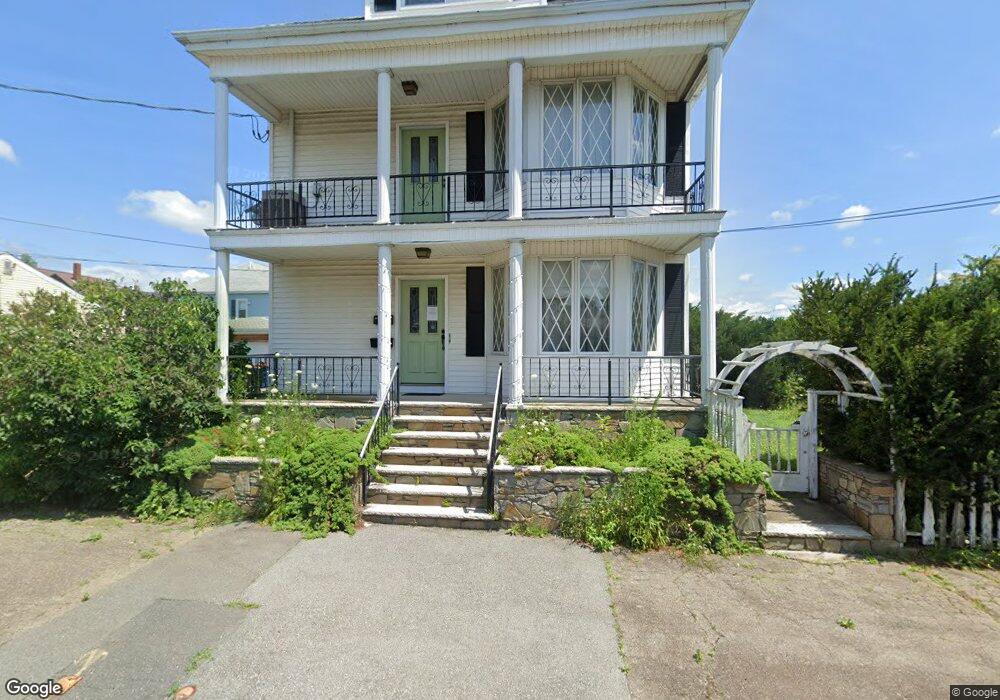
171 Osborne St Unit Floor 1 New Bedford, MA 02740
The South End NeighborhoodEstimated Value: $479,000 - $662,000
3
Beds
1
Bath
1,168
Sq Ft
$468/Sq Ft
Est. Value
About This Home
This home is located at 171 Osborne St Unit Floor 1, New Bedford, MA 02740 and is currently estimated at $546,554, approximately $467 per square foot. 171 Osborne St Unit Floor 1 is a home located in Bristol County with nearby schools including John B. DeValles Elementary School, Roosevelt Middle School, and New Bedford High School.
Ownership History
Date
Name
Owned For
Owner Type
Purchase Details
Closed on
Feb 29, 2024
Sold by
Macedo Madelyn M
Bought by
Johnson Jillian
Current Estimated Value
Home Financials for this Owner
Home Financials are based on the most recent Mortgage that was taken out on this home.
Original Mortgage
$465,500
Outstanding Balance
$456,800
Interest Rate
6.6%
Mortgage Type
Purchase Money Mortgage
Estimated Equity
$89,754
Purchase Details
Closed on
Mar 14, 2016
Sold by
Macedo Richard J
Bought by
Macedo Madelyn M
Purchase Details
Closed on
Sep 23, 2013
Sold by
Macedo Madelyn M and Lanpher Robert W
Bought by
Macedo Madelyn M and Lanpher Robert W
Home Financials for this Owner
Home Financials are based on the most recent Mortgage that was taken out on this home.
Original Mortgage
$136,300
Interest Rate
4.42%
Mortgage Type
New Conventional
Create a Home Valuation Report for This Property
The Home Valuation Report is an in-depth analysis detailing your home's value as well as a comparison with similar homes in the area
Home Values in the Area
Average Home Value in this Area
Purchase History
| Date | Buyer | Sale Price | Title Company |
|---|---|---|---|
| Johnson Jillian | $490,000 | None Available | |
| Johnson Jillian | $490,000 | None Available | |
| Macedo Madelyn M | -- | -- | |
| Macedo Madelyn M | -- | -- | |
| Macedo Madelyn M | -- | -- | |
| Macedo Madelyn M | -- | -- | |
| Macedo Madelyn M | -- | -- |
Source: Public Records
Mortgage History
| Date | Status | Borrower | Loan Amount |
|---|---|---|---|
| Open | Johnson Jillian | $465,500 | |
| Closed | Johnson Jillian | $465,500 | |
| Previous Owner | Macedo Madelyn M | $136,300 | |
| Previous Owner | Macedo Madelyn M | $100,000 |
Source: Public Records
Tax History Compared to Growth
Tax History
| Year | Tax Paid | Tax Assessment Tax Assessment Total Assessment is a certain percentage of the fair market value that is determined by local assessors to be the total taxable value of land and additions on the property. | Land | Improvement |
|---|---|---|---|---|
| 2025 | $5,472 | $483,800 | $134,200 | $349,600 |
| 2024 | $4,868 | $405,700 | $129,400 | $276,300 |
| 2023 | $4,654 | $325,700 | $108,300 | $217,400 |
| 2022 | $4,375 | $281,500 | $105,400 | $176,100 |
| 2021 | $4,314 | $276,700 | $100,600 | $176,100 |
| 2020 | $4,371 | $270,500 | $100,600 | $169,900 |
| 2019 | $4,304 | $261,300 | $100,600 | $160,700 |
| 2018 | $4,153 | $249,700 | $100,600 | $149,100 |
| 2017 | $3,890 | $233,100 | $103,000 | $130,100 |
| 2016 | $3,476 | $210,800 | $91,700 | $119,100 |
| 2015 | $3,261 | $207,300 | $91,700 | $115,600 |
| 2014 | $3,432 | $226,400 | $103,000 | $123,400 |
Source: Public Records
Map
Nearby Homes