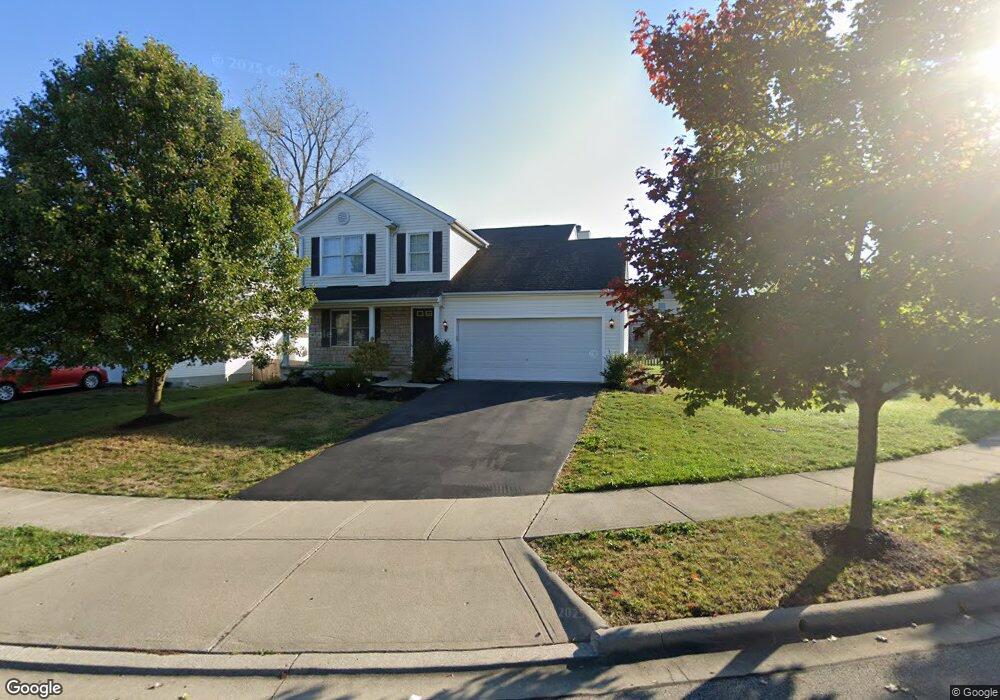
171 Ruby Red Ln Unit 8860 Delaware, OH 43015
Estimated Value: $430,000 - $468,000
4
Beds
3
Baths
1,982
Sq Ft
$227/Sq Ft
Est. Value
About This Home
This home is located at 171 Ruby Red Ln Unit 8860, Delaware, OH 43015 and is currently estimated at $450,110, approximately $227 per square foot. 171 Ruby Red Ln Unit 8860 is a home located in Delaware County with nearby schools including Cheshire Elementary School, Hyatts Middle School, and Olentangy Berlin High School.
Ownership History
Date
Name
Owned For
Owner Type
Purchase Details
Closed on
Nov 15, 2017
Sold by
Paplaczyk Julie A
Bought by
Smith Kelsey Marlow and Smith Ryan Michael
Current Estimated Value
Home Financials for this Owner
Home Financials are based on the most recent Mortgage that was taken out on this home.
Original Mortgage
$245,955
Outstanding Balance
$206,424
Interest Rate
3.91%
Mortgage Type
New Conventional
Estimated Equity
$243,686
Purchase Details
Closed on
Nov 10, 2008
Sold by
Insurance Marketing Agency Corporation
Bought by
Paplaczyk Julie A
Purchase Details
Closed on
Dec 3, 2004
Sold by
Paplaczyk Julie A
Bought by
Insurance Marketing Agency Corp
Purchase Details
Closed on
May 27, 2004
Sold by
Dominion Homes Inc
Bought by
Paplaczyk Julie A
Home Financials for this Owner
Home Financials are based on the most recent Mortgage that was taken out on this home.
Original Mortgage
$178,140
Interest Rate
3.12%
Mortgage Type
Purchase Money Mortgage
Create a Home Valuation Report for This Property
The Home Valuation Report is an in-depth analysis detailing your home's value as well as a comparison with similar homes in the area
Home Values in the Area
Average Home Value in this Area
Purchase History
| Date | Buyer | Sale Price | Title Company |
|---|---|---|---|
| Smith Kelsey Marlow | $258,900 | -- | |
| Paplaczyk Julie A | -- | Attorney | |
| Insurance Marketing Agency Corp | -- | -- | |
| Paplaczyk Julie A | $222,700 | Alliance Title |
Source: Public Records
Mortgage History
| Date | Status | Borrower | Loan Amount |
|---|---|---|---|
| Open | Smith Kelsey Marlow | $245,955 | |
| Previous Owner | Paplaczyk Julie A | $178,140 | |
| Closed | Paplaczyk Julie A | $44,535 |
Source: Public Records
Tax History
| Year | Tax Paid | Tax Assessment Tax Assessment Total Assessment is a certain percentage of the fair market value that is determined by local assessors to be the total taxable value of land and additions on the property. | Land | Improvement |
|---|---|---|---|---|
| 2024 | $6,189 | $125,480 | $27,300 | $98,180 |
| 2023 | $6,215 | $125,480 | $27,300 | $98,180 |
| 2022 | $5,853 | $94,010 | $19,250 | $74,760 |
| 2021 | $5,887 | $94,010 | $19,250 | $74,760 |
| 2020 | $5,915 | $94,010 | $19,250 | $74,760 |
| 2019 | $5,107 | $85,400 | $19,250 | $66,150 |
| 2018 | $5,131 | $85,400 | $19,250 | $66,150 |
| 2017 | $4,784 | $74,270 | $15,120 | $59,150 |
| 2016 | $4,857 | $74,270 | $15,120 | $59,150 |
| 2015 | $4,367 | $74,270 | $15,120 | $59,150 |
| 2014 | $4,431 | $74,270 | $15,120 | $59,150 |
| 2013 | $4,394 | $72,000 | $15,120 | $56,880 |
Source: Public Records
Map
Nearby Homes
- 80 Lakes at Cheshire Dr
- 366 Cherry Leaf Rd
- 74 Crystal Petal Dr
- 114 Stoneybank Dr Unit 15692 Developer Lot
- 90 Stoneybank Dr
- 102 Stoneybank Dr Unit 15694, Developer lo
- 389 Inverness Ave
- 2790 Royal Dornoch Cir
- 1464 Kenneth Dr
- 886 Ballater Dr
- 680 Covered Bridge Dr
- 749 Covered Bridge Dr
- 0 Olentangy River Rd Unit 218028010
- 173 Sycamore Ln
- 2280 Braumiller Rd
- 145 Glen Mawr Cir
- 635 Maketewah Dr
- 225 Messenger Way
- 81 Littondale Dr
- 389 Stansted Dr
- 171 Ruby Red Ln
- 155 Ruby Red Ln
- 176 Cheshire Crossing Dr
- 176 Cheshire Crossing Dr Unit 8839
- 170 Cheshire Crossing Dr
- 149 Ruby Red Ln
- 172 Ruby Red Ln
- 166 Ruby Red Ln
- 166 Ruby Red Ln Unit 8871
- 168 Cheshire Crossing Dr
- 160 Ruby Red Ln
- 143 Ruby Red Ln
- 154 Ruby Red Ln
- 154 Ruby Red Ln Unit 8873
- 164 Cheshire Crossing Dr
- 164 Cheshire Crossing Dr Unit 8842
- 148 Ruby Red Ln
- 137 Ruby Red Ln
- 137 Ruby Red Ln Unit 8856
- 158 Cheshire Crossing Dr