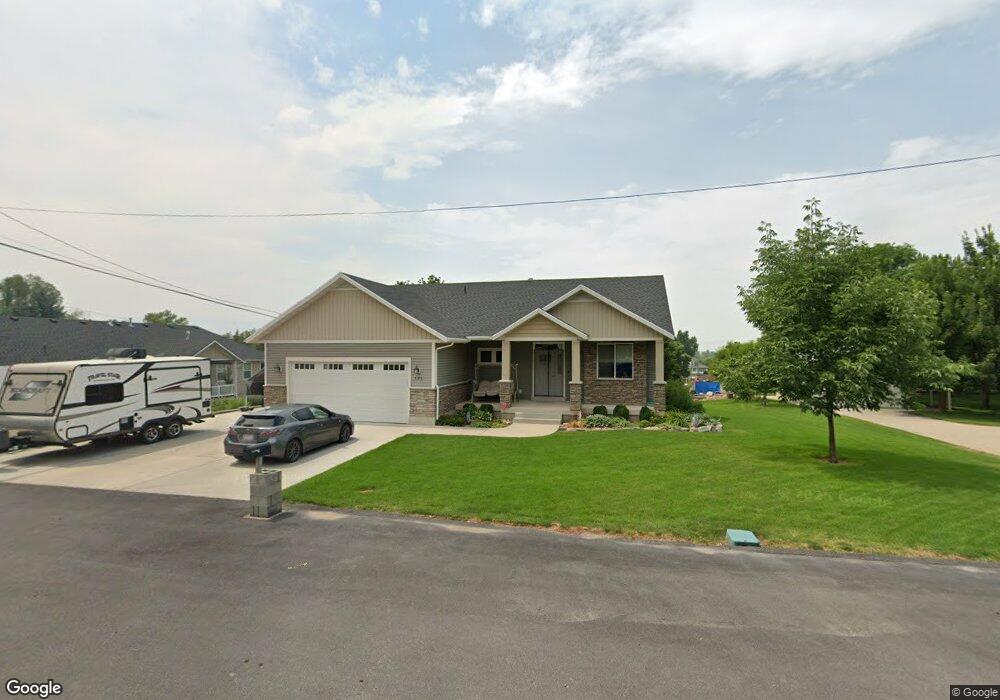
171 S 200 E Hyde Park, UT 84318
Estimated Value: $536,000 - $618,867
Studio
--
Bath
1,541
Sq Ft
$384/Sq Ft
Est. Value
About This Home
This home is located at 171 S 200 E, Hyde Park, UT 84318 and is currently estimated at $592,467, approximately $384 per square foot. 171 S 200 E is a home with nearby schools including North Park School, Cedar Ridge School, and North Cache Middle School.
Ownership History
Date
Name
Owned For
Owner Type
Purchase Details
Closed on
Mar 29, 2024
Sold by
Tueller Michael L and Tueller Marilee T
Bought by
Michael And Marilee Tueller Living Trust and Tueller
Current Estimated Value
Purchase Details
Closed on
May 14, 2014
Sold by
Homestead Construction & Development Inc
Bought by
Tueller Michael L and Tueller Marilee T
Home Financials for this Owner
Home Financials are based on the most recent Mortgage that was taken out on this home.
Original Mortgage
$214,000
Interest Rate
4.38%
Mortgage Type
New Conventional
Create a Home Valuation Report for This Property
The Home Valuation Report is an in-depth analysis detailing your home's value as well as a comparison with similar homes in the area
Home Values in the Area
Average Home Value in this Area
Purchase History
| Date | Buyer | Sale Price | Title Company |
|---|---|---|---|
| Michael And Marilee Tueller Living Trust | -- | None Listed On Document | |
| Tueller Michael L | -- | American Secure Title |
Source: Public Records
Mortgage History
| Date | Status | Borrower | Loan Amount |
|---|---|---|---|
| Previous Owner | Tueller Michael L | $214,000 |
Source: Public Records
Tax History
| Year | Tax Paid | Tax Assessment Tax Assessment Total Assessment is a certain percentage of the fair market value that is determined by local assessors to be the total taxable value of land and additions on the property. | Land | Improvement |
|---|---|---|---|---|
| 2025 | $2,455 | $338,460 | $0 | $0 |
| 2024 | $2,827 | $359,435 | $0 | $0 |
| 2023 | $3,019 | $365,155 | $0 | $0 |
| 2022 | $3,140 | $365,155 | $0 | $0 |
| 2021 | $226 | $399,779 | $66,600 | $333,179 |
| 2020 | $2,133 | $358,273 | $66,600 | $291,673 |
| 2019 | $2,247 | $358,272 | $66,600 | $291,672 |
| 2018 | $1,991 | $310,665 | $50,000 | $260,665 |
| 2017 | $2,004 | $170,515 | $0 | $0 |
| 2016 | $2,033 | $147,455 | $0 | $0 |
| 2015 | $1,739 | $147,455 | $0 | $0 |
| 2014 | $1,049 | $91,290 | $0 | $0 |
Source: Public Records
Map
Nearby Homes
- 164 E 200 S
- 520 E 100 S
- 1138 E 200 N Unit 37
- 1124 E 200 N Unit 38
- 76 W 200 S
- 290 E 450 S
- 1110 E 100 S Unit 216
- 895 E 100 N Unit 11
- 600 E 100 S
- 210 S 100 W
- 710 E 100 S
- 275 W 60 S
- 291 N Main St
- 375 N 400 E
- 276 W 450 S
- 680 S 50 E Unit 112
- 458 W Madison St S
- 1130 E 245 N
- 201 N 1000 E Unit 19
- 1109 E 245 N
Your Personal Tour Guide
Ask me questions while you tour the home.