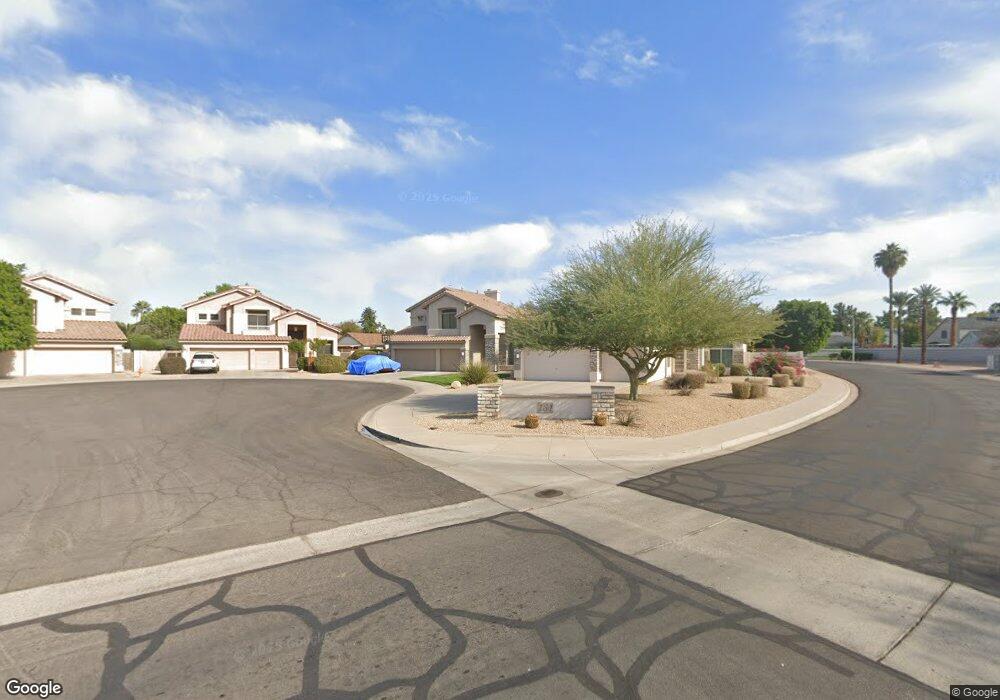
171 S Forest Ct Chandler, AZ 85226
West Chandler NeighborhoodEstimated Value: $592,146 - $705,000
--
Bed
4
Baths
2,319
Sq Ft
$282/Sq Ft
Est. Value
About This Home
This home is located at 171 S Forest Ct, Chandler, AZ 85226 and is currently estimated at $653,287, approximately $281 per square foot. 171 S Forest Ct is a home located in Maricopa County with nearby schools including Kyrene de la Paloma School, Kyrene del Pueblo Middle School, and Corona Del Sol High School.
Ownership History
Date
Name
Owned For
Owner Type
Purchase Details
Closed on
Aug 3, 1999
Sold by
Garwick Jeffrey C and Garwick Andrea H
Bought by
Rodriguez Cristobal S and Rodriguez Ernestina O
Current Estimated Value
Home Financials for this Owner
Home Financials are based on the most recent Mortgage that was taken out on this home.
Original Mortgage
$180,800
Outstanding Balance
$52,159
Interest Rate
7.7%
Mortgage Type
New Conventional
Estimated Equity
$601,128
Purchase Details
Closed on
May 29, 1998
Sold by
Cresleigh Homes Arizona Inc
Bought by
Garwick Jeffrey C and Garwick Andrea H
Home Financials for this Owner
Home Financials are based on the most recent Mortgage that was taken out on this home.
Original Mortgage
$167,096
Interest Rate
6.92%
Mortgage Type
New Conventional
Create a Home Valuation Report for This Property
The Home Valuation Report is an in-depth analysis detailing your home's value as well as a comparison with similar homes in the area
Home Values in the Area
Average Home Value in this Area
Purchase History
| Date | Buyer | Sale Price | Title Company |
|---|---|---|---|
| Rodriguez Cristobal S | $226,000 | Old Republic Title Agency | |
| Garwick Jeffrey C | $192,159 | First American Title |
Source: Public Records
Mortgage History
| Date | Status | Borrower | Loan Amount |
|---|---|---|---|
| Open | Rodriguez Cristobal S | $180,800 | |
| Previous Owner | Garwick Jeffrey C | $167,096 | |
| Closed | Garwick Jeffrey C | $20,887 |
Source: Public Records
Tax History Compared to Growth
Tax History
| Year | Tax Paid | Tax Assessment Tax Assessment Total Assessment is a certain percentage of the fair market value that is determined by local assessors to be the total taxable value of land and additions on the property. | Land | Improvement |
|---|---|---|---|---|
| 2025 | $2,762 | $34,674 | -- | -- |
| 2024 | $2,642 | $33,023 | -- | -- |
| 2023 | $2,642 | $47,900 | $9,580 | $38,320 |
| 2022 | $2,515 | $36,750 | $7,350 | $29,400 |
| 2021 | $2,652 | $33,160 | $6,630 | $26,530 |
| 2020 | $2,591 | $31,360 | $6,270 | $25,090 |
| 2019 | $2,515 | $30,650 | $6,130 | $24,520 |
| 2018 | $2,433 | $29,610 | $5,920 | $23,690 |
| 2017 | $2,318 | $27,900 | $5,580 | $22,320 |
| 2016 | $2,366 | $27,250 | $5,450 | $21,800 |
| 2015 | $2,184 | $28,330 | $5,660 | $22,670 |
Source: Public Records
Map
Nearby Homes
- 5137 W Jupiter Way
- 5143 W Mercury Way
- 5455 W Buffalo St
- 5151 W Glenview Place
- 5043 W Whitten St
- 5361 W Saragosa St
- 5330 W Kesler Ln
- 5580 W Kesler St
- 840 S Pineview Dr
- 4624 W Chicago St
- 5041 W Kesler Ln
- 4613 W Chicago St Unit 2
- 4628 W Buffalo St
- 295 N Rural Rd Unit 160
- 295 N Rural Rd Unit 128
- 295 N Rural Rd Unit 202
- 5882 W Mercury Way
- 4790 W Geronimo St
- 255 S Kyrene Rd Unit 231
- 255 S Kyrene Rd Unit 111
- 181 S Forest Ct
- 5285 W Jupiter Way S
- 161 S Forest Ct
- 5281 W Jupiter Way S
- 5289 W Jupiter Way S Unit SOUTH
- 5289 W Jupiter Way S
- 5289 W Jupiter Way S Unit S
- 5277 W Jupiter Way S
- 5286 W Jupiter Way S
- 162 S Forest Ct
- 5282 W Jupiter Way S
- 5273 W Jupiter Way S
- 5278 W Jupiter Way S
- 172 S Forest Ct
- 5317 W Jupiter Way
- 182 S Forest Ct
- 5269 W Jupiter Way S
- 5274 W Jupiter Way S
- 240 S Rush Cir W
- 242 S Rush Cir W