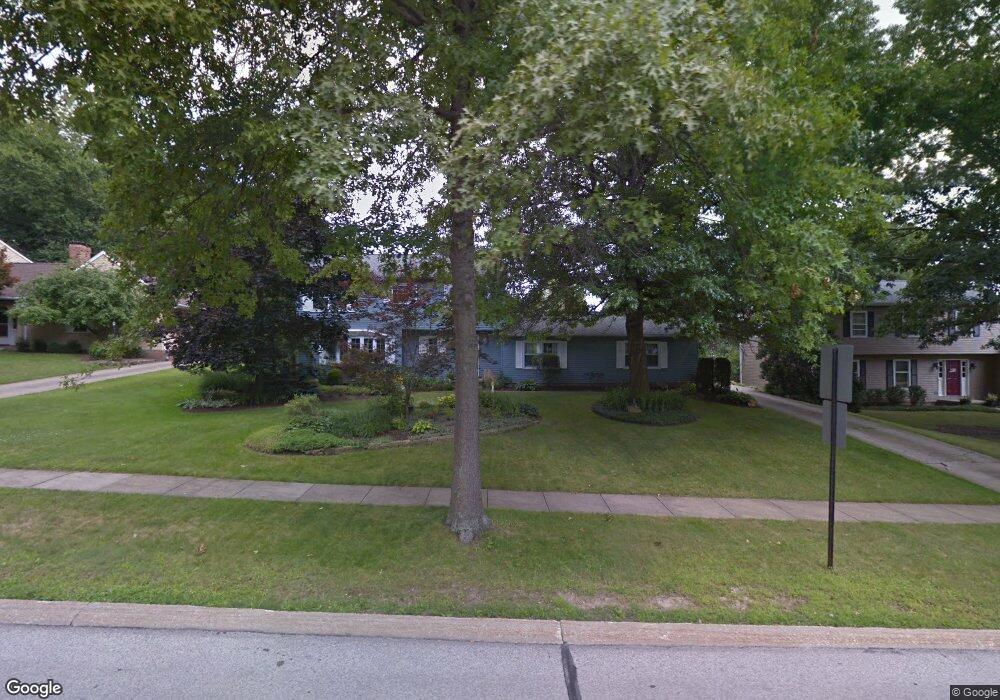
171 S Hayden Pkwy Hudson, OH 44236
Estimated Value: $440,000 - $529,000
4
Beds
3
Baths
2,166
Sq Ft
$222/Sq Ft
Est. Value
About This Home
This home is located at 171 S Hayden Pkwy, Hudson, OH 44236 and is currently estimated at $480,754, approximately $221 per square foot. 171 S Hayden Pkwy is a home located in Summit County with nearby schools including Ellsworth Hill Elementary School, East Woods Intermediate School, and Hudson Middle School.
Ownership History
Date
Name
Owned For
Owner Type
Purchase Details
Closed on
Mar 2, 2020
Sold by
Stimbra Peter W M and Stimbra Jorunn S
Bought by
Stimbra Family Revocable Livin
Current Estimated Value
Purchase Details
Closed on
Jan 8, 2020
Sold by
Stimbra Peter W M and Stimbra Jorunn S
Bought by
Stimbra Family Revocable Livin and Stimbra Jorunn S
Purchase Details
Closed on
Jul 3, 1995
Sold by
Maltarich William G
Bought by
Stimbra Peter W M and Stimbra Jorunn S
Home Financials for this Owner
Home Financials are based on the most recent Mortgage that was taken out on this home.
Original Mortgage
$154,800
Interest Rate
7.88%
Mortgage Type
New Conventional
Create a Home Valuation Report for This Property
The Home Valuation Report is an in-depth analysis detailing your home's value as well as a comparison with similar homes in the area
Home Values in the Area
Average Home Value in this Area
Purchase History
| Date | Buyer | Sale Price | Title Company |
|---|---|---|---|
| Stimbra Family Revocable Livin | -- | -- | |
| Stimbra Family Revocable Livin | -- | None Available | |
| Stimbra Peter W M | $172,000 | -- |
Source: Public Records
Mortgage History
| Date | Status | Borrower | Loan Amount |
|---|---|---|---|
| Previous Owner | Stimbra Peter W M | $154,800 |
Source: Public Records
Tax History Compared to Growth
Tax History
| Year | Tax Paid | Tax Assessment Tax Assessment Total Assessment is a certain percentage of the fair market value that is determined by local assessors to be the total taxable value of land and additions on the property. | Land | Improvement |
|---|---|---|---|---|
| 2025 | $6,716 | $131,891 | $23,482 | $108,409 |
| 2024 | $6,716 | $131,891 | $23,482 | $108,409 |
| 2023 | $6,716 | $131,891 | $23,482 | $108,409 |
| 2022 | $6,024 | $105,515 | $18,788 | $86,727 |
| 2021 | $6,034 | $105,515 | $18,788 | $86,727 |
| 2020 | $5,928 | $105,520 | $18,790 | $86,730 |
| 2019 | $5,976 | $98,500 | $18,790 | $79,710 |
| 2018 | $5,955 | $98,500 | $18,790 | $79,710 |
| 2017 | $5,139 | $98,500 | $18,790 | $79,710 |
| 2016 | $5,238 | $83,510 | $18,790 | $64,720 |
| 2015 | $5,139 | $83,510 | $18,790 | $64,720 |
| 2014 | $5,154 | $83,510 | $18,790 | $64,720 |
| 2013 | $5,268 | $83,370 | $18,790 | $64,580 |
Source: Public Records
Map
Nearby Homes
- 94 Fox Trace Ln
- 35 S Hayden Pkwy
- 148 Colony Dr
- 5937 Ogilby Dr
- 5974 Anna Lee Dr
- 21 Keswick Dr
- 5791 Sunset Dr
- 1705 Barlow Rd
- 6751 Pheasants Ridge
- 157 Hudson St
- 2380 Victoria Pkwy
- 77 Atterbury Blvd Unit 106
- 6629 Meadow Farm Dr
- 2221 Kate Ct
- 180 Atterbury Blvd
- 181 Boston Mills Rd
- 5532 Hudson Dr
- 139 Mccracken Rd
- 311 W Streetsboro St
- 6869 Saint Regis Blvd
- 177 S Hayden Pkwy
- 165 S Hayden Pkwy
- 2095 Ravenna St
- 159 S Hayden Pkwy
- 176 S Hayden Pkwy
- 170 S Hayden Pkwy
- 2078 Ravenna St
- 162 S Hayden Pkwy
- 153 S Hayden Pkwy
- 2096 Ravenna St
- 2050 Ravenna St
- 150 S Hayden Pkwy
- 147 S Hayden Pkwy
- 160 Parmelee Dr
- 319 Ravenna St
- 2106 Ravenna St
- 2038 Ravenna St
- 154 Parmelee Dr
- 141 S Hayden Pkwy
- 2118 Ravenna St