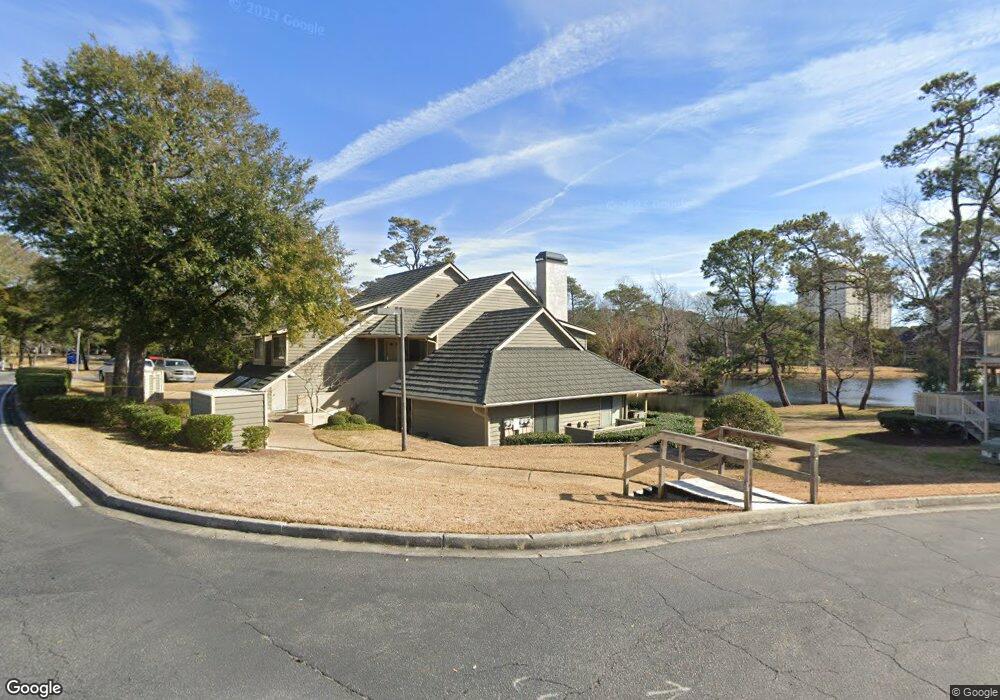
171 Saint Clears Way Unit 22 E Richmond Park Myrtle Beach, SC 29572
Arcadian Shores NeighborhoodEstimated Value: $326,482 - $368,000
3
Beds
3
Baths
1,188
Sq Ft
$299/Sq Ft
Est. Value
About This Home
This home is located at 171 Saint Clears Way Unit 22 E Richmond Park, Myrtle Beach, SC 29572 and is currently estimated at $354,621, approximately $298 per square foot. 171 Saint Clears Way Unit 22 E Richmond Park is a home located in Horry County with nearby schools including Myrtle Beach Child Development Center, Myrtle Beach Elementary School, and Myrtle Beach Primary School.
Ownership History
Date
Name
Owned For
Owner Type
Purchase Details
Closed on
Oct 29, 2021
Sold by
Marrara Caroline Ann
Bought by
Genger & Marrara Properties Llc
Current Estimated Value
Purchase Details
Closed on
May 26, 2021
Sold by
Bartholomew Annie E
Bought by
Marrara Caroline Ann and Genger Steven John
Home Financials for this Owner
Home Financials are based on the most recent Mortgage that was taken out on this home.
Original Mortgage
$180,000
Interest Rate
2.9%
Mortgage Type
New Conventional
Purchase Details
Closed on
Sep 27, 2002
Sold by
Edmundowicz Alphonse C and Edmundowicz Josephine A
Bought by
Flock William F and Flock Janet E
Home Financials for this Owner
Home Financials are based on the most recent Mortgage that was taken out on this home.
Original Mortgage
$152,000
Interest Rate
6.21%
Mortgage Type
Unknown
Create a Home Valuation Report for This Property
The Home Valuation Report is an in-depth analysis detailing your home's value as well as a comparison with similar homes in the area
Home Values in the Area
Average Home Value in this Area
Purchase History
| Date | Buyer | Sale Price | Title Company |
|---|---|---|---|
| Genger & Marrara Properties Llc | -- | -- | |
| Marrara Caroline Ann | $240,000 | -- | |
| Flock William F | $215,000 | -- |
Source: Public Records
Mortgage History
| Date | Status | Borrower | Loan Amount |
|---|---|---|---|
| Previous Owner | Marrara Caroline Ann | $180,000 | |
| Previous Owner | Flock William F | $152,000 |
Source: Public Records
Tax History Compared to Growth
Tax History
| Year | Tax Paid | Tax Assessment Tax Assessment Total Assessment is a certain percentage of the fair market value that is determined by local assessors to be the total taxable value of land and additions on the property. | Land | Improvement |
|---|---|---|---|---|
| 2024 | $3,488 | $22,320 | $0 | $22,320 |
| 2023 | $3,488 | $22,050 | $0 | $22,050 |
| 2021 | $3,216 | $22,050 | $0 | $22,050 |
| 2020 | $2,629 | $22,050 | $0 | $22,050 |
| 2019 | $2,629 | $22,050 | $0 | $22,050 |
| 2018 | $0 | $24,150 | $0 | $24,150 |
| 2017 | $2,965 | $13,800 | $0 | $13,800 |
| 2016 | $0 | $13,800 | $0 | $13,800 |
| 2015 | -- | $24,150 | $0 | $24,150 |
| 2014 | $2,101 | $10,080 | $0 | $10,080 |
Source: Public Records
Map
Nearby Homes
- 175 Saint Clears Way Unit 23-I
- 175 Saint Clears Way Unit 23A
- 215 Baslow Ct Unit 1D
- 211 Baslow Ct Unit 2-C
- 204 Baslow Ct Unit 20-F
- 180 Rothbury Cir Unit 116
- 180 Rothbury Cir Unit 302
- 180 Rothbury Cir Unit 303
- 180 Rothbury Cir Unit 305
- 180 Rothbury Cir Unit 203
- 207 Baslow Ct Unit 3-A
- 145 Hartland Dr Unit 4-E
- 800 Castleford Cir Unit 1-E
- 800 Castleford Cir Unit 1-H
- 800 Castleford Cir Unit 1-C
- 141 Hartland Dr Unit 5-C
- 301 Myrtlewood Ct Unit 17-E
- 104 High Cir Unit 8C
- 104 High Cir Unit 8H
- 110 Hartland Dr Unit 15-E
- 171 Saint Clears Way Unit 22-B Richmond Park
- 171 Saint Clears Way Unit 22-A Richmond Park
- 171 Saint Clears Way Unit 22E
- 171 Saint Clears Way Unit 22C
- 171 Saint Clears Way Unit 22-A
- 171 Saint Clears Way Unit 22-B
- 175 Saint Clears Way Unit 23-F Richmond Park
- 175 Saint Clears Way Unit 23-A Richmond Park
- 175 Saint Clears Way Unit 23-H Richmond Park
- 175 Saint Clears Way Unit 23-E Richmond Park
- 175 Saint Clears Way Unit 23-C Richmond Park
- 175 Saint Clears Way Unit 23-B Richmond Park
- 175 Saint Clears Way Unit 23H
- 175 Saint Clears Way Unit 23F
- 175 Saint Clears Way Unit 23E
- 175 Saint Clears Way Unit 23-B
- 175 Saint Clears Way Unit 23-C
- 175 Saint Clears Way Unit 23G
- 175 Saint Clears Way Unit 23-D
- 175 St Clears Way Unit 23-B