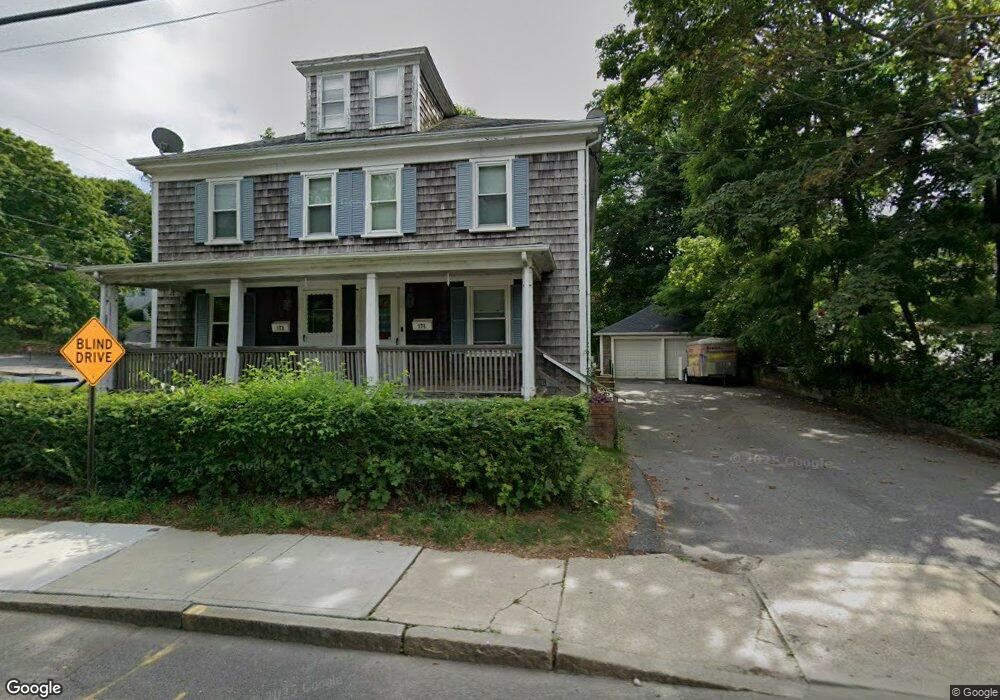
171 Sandwich St Plymouth, MA 02360
Plymouth Center NeighborhoodEstimated Value: $440,000 - $1,236,000
3
Beds
1
Bath
1,292
Sq Ft
$514/Sq Ft
Est. Value
About This Home
This home is located at 171 Sandwich St, Plymouth, MA 02360 and is currently estimated at $664,088, approximately $514 per square foot. 171 Sandwich St is a home located in Plymouth County with nearby schools including Nathaniel Morton Elementary School, Plymouth Community Intermediate, and Plymouth North High School.
Ownership History
Date
Name
Owned For
Owner Type
Purchase Details
Closed on
Aug 14, 2013
Sold by
Beneficial Mass Inc
Bought by
Breen Jason
Current Estimated Value
Home Financials for this Owner
Home Financials are based on the most recent Mortgage that was taken out on this home.
Original Mortgage
$107,200
Outstanding Balance
$79,466
Interest Rate
4.31%
Mortgage Type
New Conventional
Estimated Equity
$584,622
Purchase Details
Closed on
Jan 15, 2013
Sold by
Welch Sarah T
Bought by
Beneficial Mass Inc
Purchase Details
Closed on
Jun 30, 2005
Sold by
Watson Marsha N and Watson Emily J
Bought by
Welch Sarah T
Purchase Details
Closed on
Jul 16, 2004
Sold by
Watson Marsha N
Bought by
Watson Marsha N and Watson Emily J
Purchase Details
Closed on
May 24, 2004
Sold by
Ren Rt and Nahill Robert G
Bought by
Maccow Derryl R
Create a Home Valuation Report for This Property
The Home Valuation Report is an in-depth analysis detailing your home's value as well as a comparison with similar homes in the area
Home Values in the Area
Average Home Value in this Area
Purchase History
| Date | Buyer | Sale Price | Title Company |
|---|---|---|---|
| Breen Jason | $134,000 | -- | |
| Breen Jason | $134,000 | -- | |
| Beneficial Mass Inc | $153,887 | -- | |
| Welch Sarah T | $253,500 | -- | |
| Watson Marsha N | -- | -- | |
| Maccow Derryl R | $243,500 | -- |
Source: Public Records
Mortgage History
| Date | Status | Borrower | Loan Amount |
|---|---|---|---|
| Open | Breen Jason | $107,200 | |
| Closed | Breen Jason | $107,200 | |
| Previous Owner | Maccow Derryl R | $247,881 | |
| Previous Owner | Maccow Derryl R | $25,000 |
Source: Public Records
Tax History Compared to Growth
Tax History
| Year | Tax Paid | Tax Assessment Tax Assessment Total Assessment is a certain percentage of the fair market value that is determined by local assessors to be the total taxable value of land and additions on the property. | Land | Improvement |
|---|---|---|---|---|
| 2025 | $3,997 | $315,000 | $0 | $315,000 |
| 2024 | $3,983 | $309,500 | $0 | $309,500 |
| 2023 | $3,872 | $282,400 | $0 | $282,400 |
| 2022 | $3,702 | $239,900 | $0 | $239,900 |
| 2021 | $3,790 | $234,500 | $0 | $234,500 |
| 2020 | $3,834 | $234,500 | $0 | $234,500 |
| 2019 | $3,674 | $222,100 | $0 | $222,100 |
| 2018 | $3,552 | $215,800 | $0 | $215,800 |
| 2017 | $3,578 | $215,800 | $0 | $215,800 |
| 2016 | $3,441 | $211,500 | $0 | $211,500 |
| 2015 | $3,287 | $211,500 | $0 | $211,500 |
| 2014 | $3,200 | $211,500 | $0 | $211,500 |
Source: Public Records
Map
Nearby Homes
- 4 Nook Rd
- 204 Sandwich St Unit 2N
- 27 1/2 Fremont St Unit 2
- 14-16 South St
- 253 Sandwich St
- 15 Coles Ln
- 20 Bradford St
- 9 Hill Dale Rd
- 14 Meadowbrook Dr
- 8 Carver St
- 49 Bumble Bee Dr
- 5 Bumble Bee Dr
- 91 Newfield St Unit 34
- 38 Russell St Unit 4
- 126 Summer St
- 10 Brewster St
- 72 Warren Ave
- 23 Howland St Unit 4
- 7 Sever St Unit 2
- 12 Old Barn Rd
- 173 Sandwich St
- 171 Sandwich St
- 171 Sandwich St Unit 1-1
- 171 Sandwich St Unit 1
- 165 Sandwich St
- 01 Brookside Ave
- 162 Sandwich St
- 162 Sandwich St Unit 2
- 162 Sandwich St Unit 1
- 177 Sandwich St Unit 2
- 177 Sandwich St
- 170 Sandwich Unit 1
- 5 Brookside Ave
- 6 Brookside Ave
- 160 Sandwich St
- 172 Sandwich St Unit 172
- 172 Sandwich St Unit 2
- 10 Brookside Ave
- 4 Bay View Ave
- 174 Sandwich St Unit 174