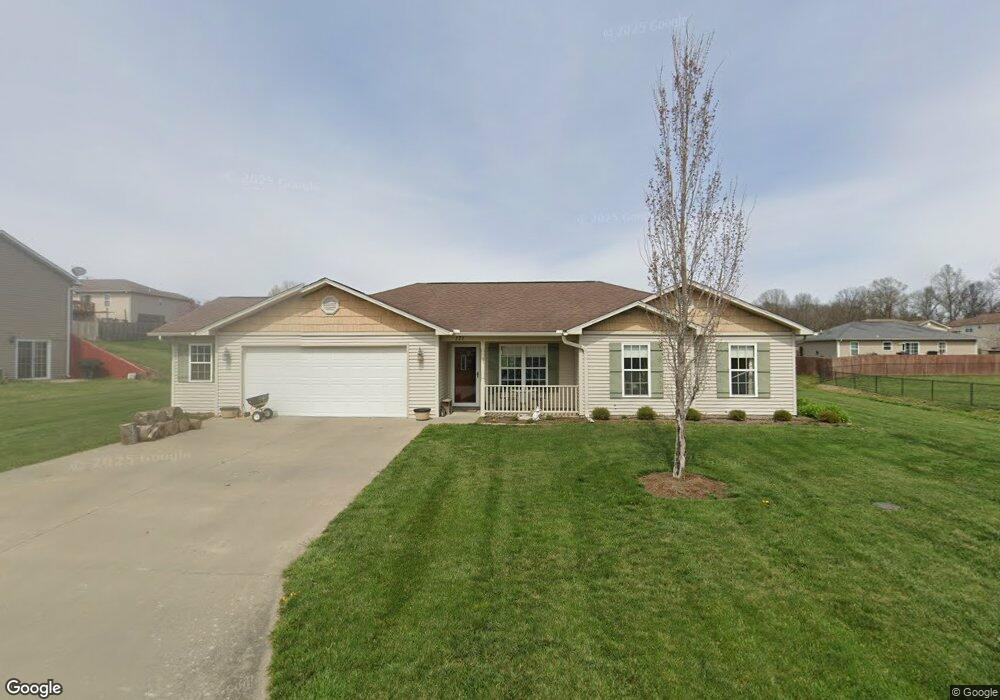
171 Silver Hawk Ln Cape Girardeau, MO 63701
Estimated Value: $229,144 - $264,000
3
Beds
2
Baths
1,281
Sq Ft
$195/Sq Ft
Est. Value
About This Home
This home is located at 171 Silver Hawk Ln, Cape Girardeau, MO 63701 and is currently estimated at $250,286, approximately $195 per square foot. 171 Silver Hawk Ln is a home located in Cape Girardeau County with nearby schools including Russell Hawkins Junior High School, Jackson Senior High School, and Immaculate Conception School.
Ownership History
Date
Name
Owned For
Owner Type
Purchase Details
Closed on
Apr 9, 2020
Sold by
Blasiney Robert J and Blasiney Debra S
Bought by
Siemers Justin L and Siemers Kristen E
Current Estimated Value
Purchase Details
Closed on
May 14, 2013
Sold by
Siemers Kasey Marie
Bought by
Siemers Jsutin Lee
Purchase Details
Closed on
Apr 5, 2010
Sold by
Show Inc Construction Co Inc
Bought by
Siemers Justin
Home Financials for this Owner
Home Financials are based on the most recent Mortgage that was taken out on this home.
Original Mortgage
$114,323
Interest Rate
4.96%
Mortgage Type
FHA
Purchase Details
Closed on
Nov 10, 2009
Sold by
Hawks Landing Development Llc
Bought by
Show Me Construction Co Inc
Home Financials for this Owner
Home Financials are based on the most recent Mortgage that was taken out on this home.
Original Mortgage
$103,920
Interest Rate
4.9%
Mortgage Type
Future Advance Clause Open End Mortgage
Create a Home Valuation Report for This Property
The Home Valuation Report is an in-depth analysis detailing your home's value as well as a comparison with similar homes in the area
Home Values in the Area
Average Home Value in this Area
Purchase History
| Date | Buyer | Sale Price | Title Company |
|---|---|---|---|
| Siemers Justin L | -- | None Available | |
| Siemers Jsutin Lee | -- | -- | |
| Siemers Justin | -- | None Available | |
| Show Me Construction Co Inc | -- | None Available |
Source: Public Records
Mortgage History
| Date | Status | Borrower | Loan Amount |
|---|---|---|---|
| Previous Owner | Siemers Justin | $114,323 | |
| Previous Owner | Show Me Construction Co Inc | $103,920 |
Source: Public Records
Tax History Compared to Growth
Tax History
| Year | Tax Paid | Tax Assessment Tax Assessment Total Assessment is a certain percentage of the fair market value that is determined by local assessors to be the total taxable value of land and additions on the property. | Land | Improvement |
|---|---|---|---|---|
| 2025 | $1,362 | $28,380 | $7,170 | $21,210 |
| 2024 | $12 | $27,020 | $6,820 | $20,200 |
| 2023 | $1,227 | $27,020 | $6,820 | $20,200 |
| 2022 | $1,130 | $24,910 | $6,290 | $18,620 |
| 2021 | $1,130 | $24,910 | $6,290 | $18,620 |
| 2020 | $1,134 | $24,910 | $6,290 | $18,620 |
| 2019 | $1,132 | $24,910 | $0 | $0 |
| 2018 | $1,130 | $24,910 | $0 | $0 |
| 2017 | $1,134 | $24,910 | $0 | $0 |
| 2016 | $1,104 | $24,530 | $0 | $0 |
| 2015 | $1,105 | $24,530 | $0 | $0 |
| 2014 | $1,112 | $24,530 | $0 | $0 |
Source: Public Records
Map
Nearby Homes
- 5748 State Highway 25
- 890 State Highway Z
- 357 Timber Ln
- 137
- 0 Lots 143-144 179-180 Saddlebrooke Ridge
- 1708 Warren Lake Dr
- 1656 Warren Lake Dr
- 1393 Warren Lake Dr
- 1614 Warren Lake Dr
- 286 Old Wagon Trail
- 1201 Cherokee St
- 0 Whispy Trail
- 2405 Brittany Dr
- 930 Jackson Trail
- 34 Waterhole Trail
- 1120 Pawnee St
- 5327 Pinedale Dr
- 5302 Pinedale Dr
- 415 Berchman St
- 918 Donna Dr
- 151 Silver Hawk Ln
- 168 Timber Hawk Trail
- 150 Timber Hawk Trail
- 164 Silver Hawk Ln
- 200 Silver Hawk Ln
- 196 Timber Hawk Trail
- 135 Silver Hawk Ln
- 221 Silver Hawk Ln
- 144 Silver Hawk Ln
- 130 Timber Hawk Trail
- 218 Silver Hawk Ln
- 216 Timber Hawk Trail
- 169 Timber Hawk Trail
- 197 Timber Hawk Trail
- 199 Red Hawk Ridge
- 151 Timber Hawk Trail
- 171 Red Hawk Ridge
- 215 Red Hawk Ridge
- 111 Silver Hawk Ln
- 112 Timber Hawk Trail