Estimated Value: $430,199 - $638,000
3
Beds
3
Baths
2,032
Sq Ft
$261/Sq Ft
Est. Value
About This Home
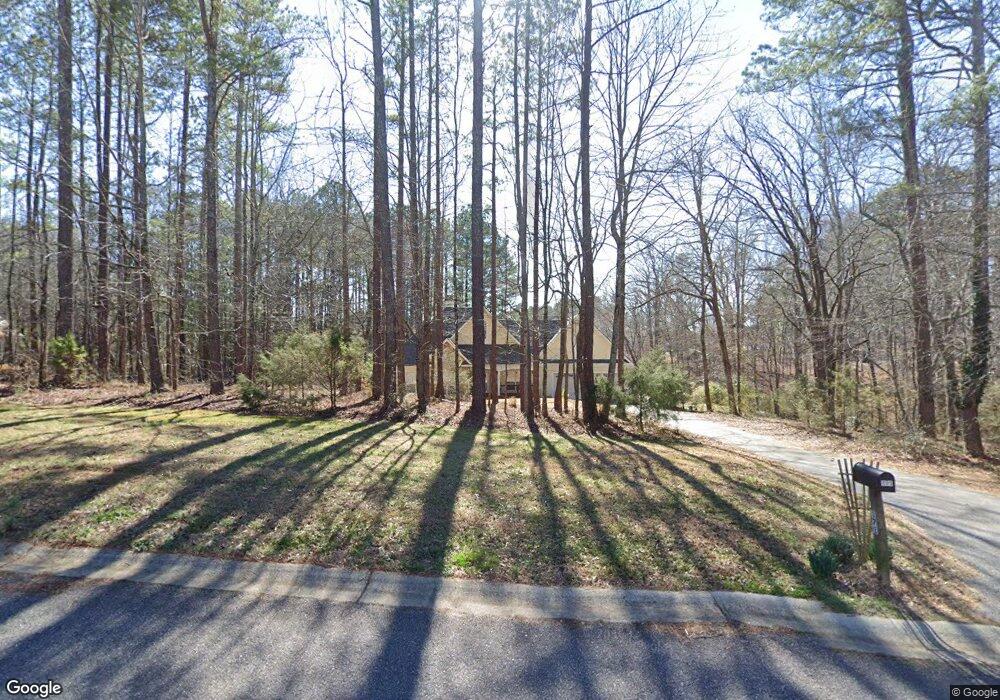
This home is located at 171 Spratlin Ponds Dr, Hull, GA 30646 and is currently estimated at $529,550, approximately $260 per square foot. 171 Spratlin Ponds Dr is a home located in Madison County with nearby schools including Madison County High School.
Ownership History
Date
Name
Owned For
Owner Type
Purchase Details
Closed on
Aug 1, 2016
Sold by
Ryan L
Bought by
Holt Ryan L and Holt Karina Calzada
Current Estimated Value
Home Financials for this Owner
Home Financials are based on the most recent Mortgage that was taken out on this home.
Original Mortgage
$156,319
Outstanding Balance
$98,516
Interest Rate
3.48%
Mortgage Type
New Conventional
Estimated Equity
$431,034
Purchase Details
Closed on
Feb 2, 2006
Sold by
Powell James P
Bought by
Holt Ryan L
Home Financials for this Owner
Home Financials are based on the most recent Mortgage that was taken out on this home.
Original Mortgage
$180,200
Interest Rate
6.14%
Mortgage Type
New Conventional
Purchase Details
Closed on
Oct 20, 2003
Sold by
Bryam John W
Bought by
Powell James P and Powell Rita S
Purchase Details
Closed on
Jul 18, 2003
Sold by
Spratlin Ponds Dev L
Bought by
Bryam John W
Purchase Details
Closed on
Aug 25, 1999
Bought by
Spratlin Ponds Dev L
Create a Home Valuation Report for This Property
The Home Valuation Report is an in-depth analysis detailing your home's value as well as a comparison with similar homes in the area
Home Values in the Area
Average Home Value in this Area
Purchase History
| Date | Buyer | Sale Price | Title Company |
|---|---|---|---|
| Holt Ryan L | -- | -- | |
| Holt Ryan L | $228,000 | -- | |
| Powell James P | $189,000 | -- | |
| Bryam John W | $34,200 | -- | |
| Spratlin Ponds Dev L | -- | -- |
Source: Public Records
Mortgage History
| Date | Status | Borrower | Loan Amount |
|---|---|---|---|
| Open | Holt Ryan L | $156,319 | |
| Previous Owner | Holt Ryan L | $180,200 | |
| Previous Owner | Holt Ryan L | $25,000 |
Source: Public Records
Tax History Compared to Growth
Tax History
| Year | Tax Paid | Tax Assessment Tax Assessment Total Assessment is a certain percentage of the fair market value that is determined by local assessors to be the total taxable value of land and additions on the property. | Land | Improvement |
|---|---|---|---|---|
| 2024 | $4,002 | $155,746 | $18,000 | $137,746 |
| 2023 | $4,484 | $146,870 | $18,000 | $128,870 |
| 2022 | $3,582 | $131,860 | $18,000 | $113,860 |
| 2021 | $3,152 | $105,239 | $18,000 | $87,239 |
| 2020 | $3,107 | $103,082 | $18,000 | $85,082 |
| 2019 | $2,740 | $90,101 | $14,400 | $75,701 |
| 2018 | $2,690 | $88,248 | $14,400 | $73,848 |
| 2017 | $2,562 | $88,992 | $14,400 | $74,592 |
| 2016 | $2,171 | $77,627 | $14,400 | $63,227 |
| 2015 | $2,172 | $77,627 | $14,400 | $63,227 |
| 2014 | $2,169 | $77,081 | $14,400 | $62,681 |
| 2013 | -- | $80,681 | $18,000 | $62,681 |
Source: Public Records
Map
Nearby Homes
- 1330 McCannon-morris Rd
- 1270 McCannon Morris Rd
- 7241 Highway 29 S
- 6716 U S 29
- 210 Joe Graham Rd
- 703 Jack Sharp Rd
- 0 Spratlin Mill Dr Unit 7665837
- 0 Spratlin Mill Dr Unit LOT 14-C
- 385 McCannon Morris Rd
- 1329 Spratlin Mill Dr
- 660 McCannon Morris Rd
- 119 Jack Sharp Rd
- 465 Stone Creek Dr
- 151 Rolling Woods Ln
- 103 Three Rivers Ct
- 149 Candlestick Dr
- 124 E Piedmont Park
- 3965 Highway 29 S
- 1045 Garnett Ward Rd Unit 4
- 139 Spratlin Ponds Dr
- 129 Overlook Dr
- Lot 9 Spratlin Ponds Dr
- Lot 20 Spratlin Ponds Dr
- Lot 15 Spratlin Ponds Dr
- Lot 7 Spratlin Ponds Dr
- Lot 19 Spratlin Ponds Dr
- Lot 10 Spratlin Ponds Dr
- Lot 18 Spratlin Ponds Dr
- Lot 16 Spratlin Ponds Dr
- Lot 4 Spratlin Ponds Dr
- 60 Forest Ct
- 0 Spratlin Ponds Dr
- 140 Spratlin Ponds Dr
- 0 Overlook Dr Unit 7033486
- 0 Overlook Dr Unit 8689145
- 0 Overlook Dr Unit 3205827
- 0 Overlook Dr Unit 7057972
- 52 Overlook Dr
- 100 Overlook Dr