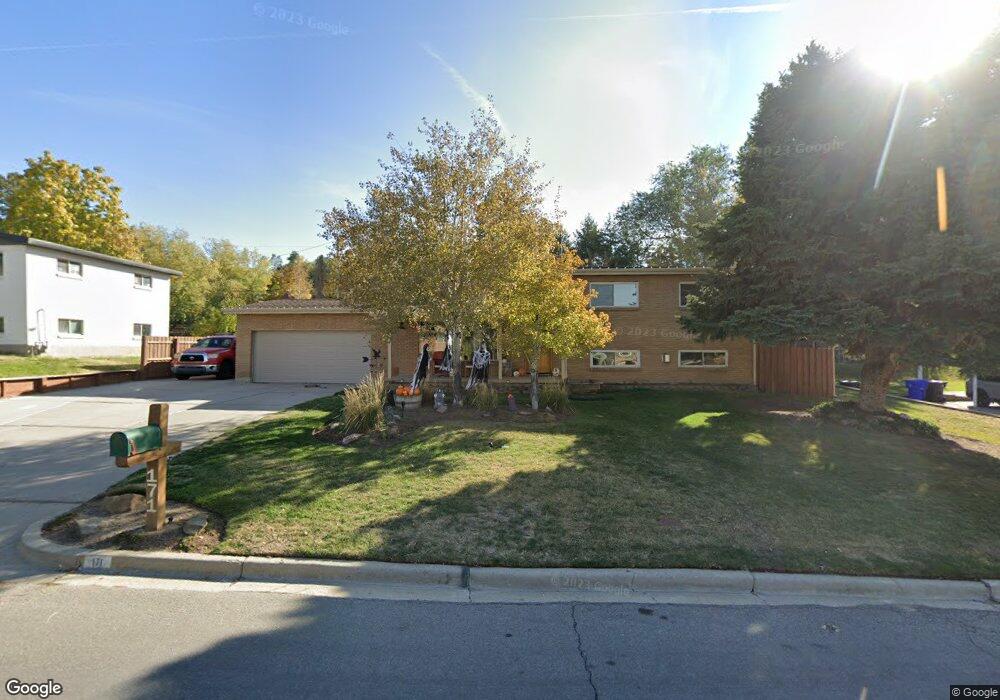
171 W 2800 S Bountiful, UT 84010
Estimated Value: $494,000 - $550,000
4
Beds
3
Baths
1,600
Sq Ft
$324/Sq Ft
Est. Value
About This Home
This home is located at 171 W 2800 S, Bountiful, UT 84010 and is currently estimated at $518,314, approximately $323 per square foot. 171 W 2800 S is a home located in Davis County with nearby schools including Boulton School, South Davis Junior High School, and Woods Cross High School.
Ownership History
Date
Name
Owned For
Owner Type
Purchase Details
Closed on
Nov 29, 2016
Sold by
Nelson Mark W and Nelson Julie W
Bought by
Turbyfill Jessica and Turbyfill Stuart
Current Estimated Value
Purchase Details
Closed on
Oct 11, 2005
Sold by
Nelson Julie W and Nelson Mark W
Bought by
Nelson Mark W and Nelson Julie W
Home Financials for this Owner
Home Financials are based on the most recent Mortgage that was taken out on this home.
Original Mortgage
$100,000
Interest Rate
5.63%
Mortgage Type
New Conventional
Purchase Details
Closed on
Dec 14, 2004
Sold by
Carolan Julie W and Nelson Julie W
Bought by
Nelson Mark W and Nelson Julie W
Purchase Details
Closed on
Nov 8, 2004
Sold by
Carolan Julie W
Bought by
Nelson Julie W and Nelson Mark W
Purchase Details
Closed on
Jun 21, 2001
Sold by
Slater Steven D and Slater Tamera A
Bought by
Carolan Julie W
Create a Home Valuation Report for This Property
The Home Valuation Report is an in-depth analysis detailing your home's value as well as a comparison with similar homes in the area
Purchase History
| Date | Buyer | Sale Price | Title Company |
|---|---|---|---|
| Turbyfill Jessica | -- | Us Title | |
| Nelson Mark W | -- | First American Title | |
| Nelson Mark W | -- | -- | |
| Nelson Julie W | -- | -- | |
| Carolan Julie W | -- | Mountain View Title & Escrow |
Source: Public Records
Mortgage History
| Date | Status | Borrower | Loan Amount |
|---|---|---|---|
| Previous Owner | Nelson Mark W | $100,000 |
Source: Public Records
Tax History
| Year | Tax Paid | Tax Assessment Tax Assessment Total Assessment is a certain percentage of the fair market value that is determined by local assessors to be the total taxable value of land and additions on the property. | Land | Improvement |
|---|---|---|---|---|
| 2025 | $2,782 | $253,000 | $136,186 | $116,814 |
| 2024 | $2,648 | $244,750 | $122,861 | $121,889 |
| 2023 | $2,534 | $422,000 | $224,976 | $197,024 |
| 2022 | $2,395 | $223,300 | $122,564 | $100,736 |
| 2021 | $2,196 | $314,000 | $160,449 | $153,551 |
| 2020 | $1,935 | $277,000 | $136,556 | $140,444 |
| 2019 | $1,939 | $275,000 | $140,843 | $134,157 |
| 2018 | $1,806 | $252,000 | $137,984 | $114,016 |
| 2016 | $1,356 | $108,405 | $44,593 | $63,812 |
| 2015 | $1,300 | $98,285 | $44,593 | $53,692 |
| 2014 | $1,223 | $94,550 | $44,593 | $49,957 |
| 2013 | -- | $97,594 | $38,051 | $59,543 |
Source: Public Records
Map
Nearby Homes
- 337 W 2900 S
- 404 W 2700 S
- 19 E North Canyon Rd
- 69 E North Canyon Rd
- 3291 S 300 W
- 166 E 3000 S
- 11 E Bonneville Dr
- 468 W 3200 S
- 552 W 2900 S
- 544 W 2900 S
- 554 W 2900 S
- 336 W 3500 S
- 110 2250 S
- 41 E 2200 S
- 8 E 3500 S
- 221 E 2450 S
- 3433 S 525 W
- 2292 S 250 E
- 620 N Orchard Dr Unit 18
- 620 N Orchard Dr Unit 30
Your Personal Tour Guide
Ask me questions while you tour the home.