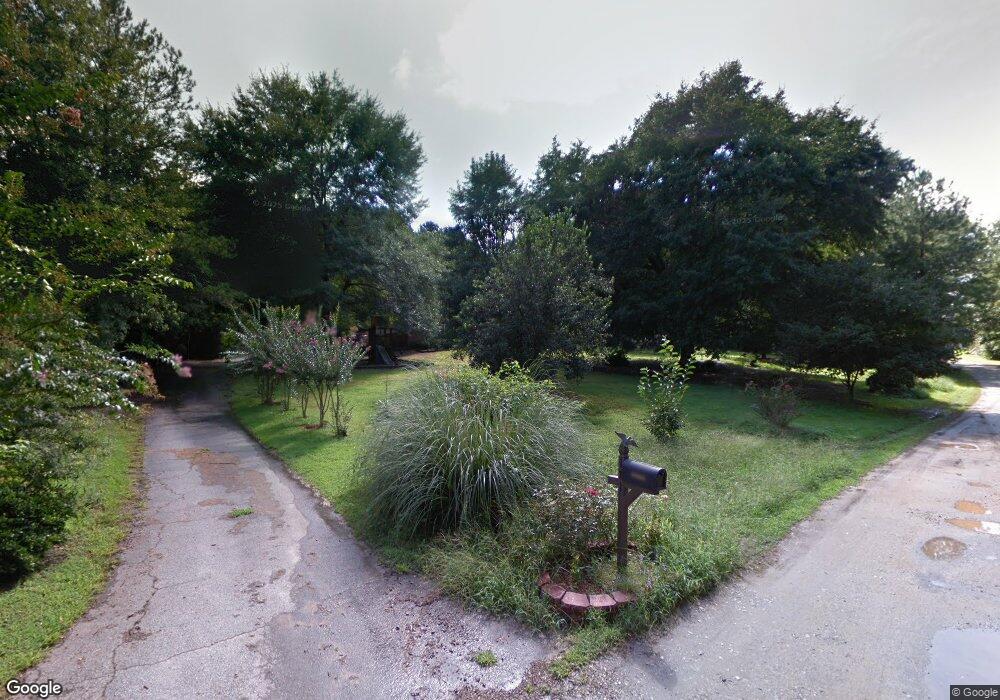
171 Wilson Garage Rd Commerce, GA 30529
Estimated Value: $274,484 - $394,000
--
Bed
3
Baths
1,575
Sq Ft
$209/Sq Ft
Est. Value
About This Home
This home is located at 171 Wilson Garage Rd, Commerce, GA 30529 and is currently estimated at $328,621, approximately $208 per square foot. 171 Wilson Garage Rd is a home located in Jackson County with nearby schools including Maysville Elementary School, East Jackson Middle School, and East Jackson Comprehensive High School.
Ownership History
Date
Name
Owned For
Owner Type
Purchase Details
Closed on
Apr 11, 2018
Sold by
Reynolds Sandra Ann
Bought by
Maddox Gary Wendell
Current Estimated Value
Purchase Details
Closed on
Sep 13, 2016
Sold by
Maddox Ann
Bought by
Reynolds Sandra Ann
Purchase Details
Closed on
Oct 3, 2001
Sold by
Rogers Thomas W
Bought by
Simonds Bonnie
Purchase Details
Closed on
Aug 4, 2000
Sold by
Vickery Mike
Bought by
Rogers Thomas W
Purchase Details
Closed on
Oct 26, 1999
Sold by
Watson Donna Elise
Bought by
Vickery Mike
Purchase Details
Closed on
Oct 26, 1998
Sold by
Watson Edwin and Watson Donna
Bought by
Watson Donna Elise
Create a Home Valuation Report for This Property
The Home Valuation Report is an in-depth analysis detailing your home's value as well as a comparison with similar homes in the area
Home Values in the Area
Average Home Value in this Area
Purchase History
| Date | Buyer | Sale Price | Title Company |
|---|---|---|---|
| Maddox Gary Wendell | -- | -- | |
| Reynolds Sandra Ann | -- | -- | |
| Simonds Bonnie | $104,500 | -- | |
| Rogers Thomas W | $77,500 | -- | |
| Vickery Mike | $71,400 | -- | |
| Watson Donna Elise | -- | -- |
Source: Public Records
Tax History Compared to Growth
Tax History
| Year | Tax Paid | Tax Assessment Tax Assessment Total Assessment is a certain percentage of the fair market value that is determined by local assessors to be the total taxable value of land and additions on the property. | Land | Improvement |
|---|---|---|---|---|
| 2024 | $1,999 | $79,428 | $21,520 | $57,908 |
| 2023 | $1,999 | $72,668 | $21,520 | $51,148 |
| 2022 | $1,358 | $47,348 | $7,280 | $40,068 |
| 2021 | $1,367 | $47,348 | $7,280 | $40,068 |
| 2020 | $1,245 | $39,348 | $7,280 | $32,068 |
| 2019 | $1,264 | $39,348 | $7,280 | $32,068 |
| 2018 | $1,263 | $38,760 | $7,280 | $31,480 |
| 2017 | $1,154 | $35,146 | $6,953 | $28,193 |
| 2016 | $1,100 | $35,146 | $6,953 | $28,193 |
| 2015 | $1,105 | $35,146 | $6,953 | $28,193 |
| 2014 | $956 | $30,435 | $6,953 | $23,482 |
| 2013 | -- | $34,732 | $7,318 | $27,413 |
Source: Public Records
Map
Nearby Homes
- 539 B Wilson Rd
- 8569 Jefferson Rd
- 379 Mount Olive Church Rd
- 191 Orchard Cir
- 310 Lewis Cir
- 2280 N Broad St
- 414 Ridgeway St
- 177 Bolton Dr
- 25 Beckett Way
- 27 Andy Ct
- 2140 N Broad St
- 229 Homer Rd
- 0 Ridgeway St
- 47 Shelby Ct Unit HOMESITE 28
- 103 Sherwood Dr Unit LOT 16
- 151 Sage St Unit LOT 38
- 207 Sage St Unit LOT 35
- 196 Sage St Unit HOMESITE 30
- 125 Sherwood Dr Unit LOT 15
- 207 Wilson Garage Rd
- 0000 Wilson Garage Rd
- 135 Wilson Garage Rd
- 371 Wilson Garage Rd
- 310 B Wilson Rd
- 242 Wilson Garage Rd
- 398 B Wilson Rd
- 338 B Wilson Rd
- 338 B Wilson Rd
- 188 B Wilson Rd
- 341 B Wilson Rd
- 46 Wilson Garage Rd
- 546 B Wilson Rd
- 0 Wilson Garage Rd Unit 10113686
- 0 Wilson Garage Rd Unit 1003643
- 0 Wilson Garage Rd Unit 956326
- 0 Wilson Garage Rd Unit 8187837
- 297 B Wilson Rd
- 138 Clyde Short Rd