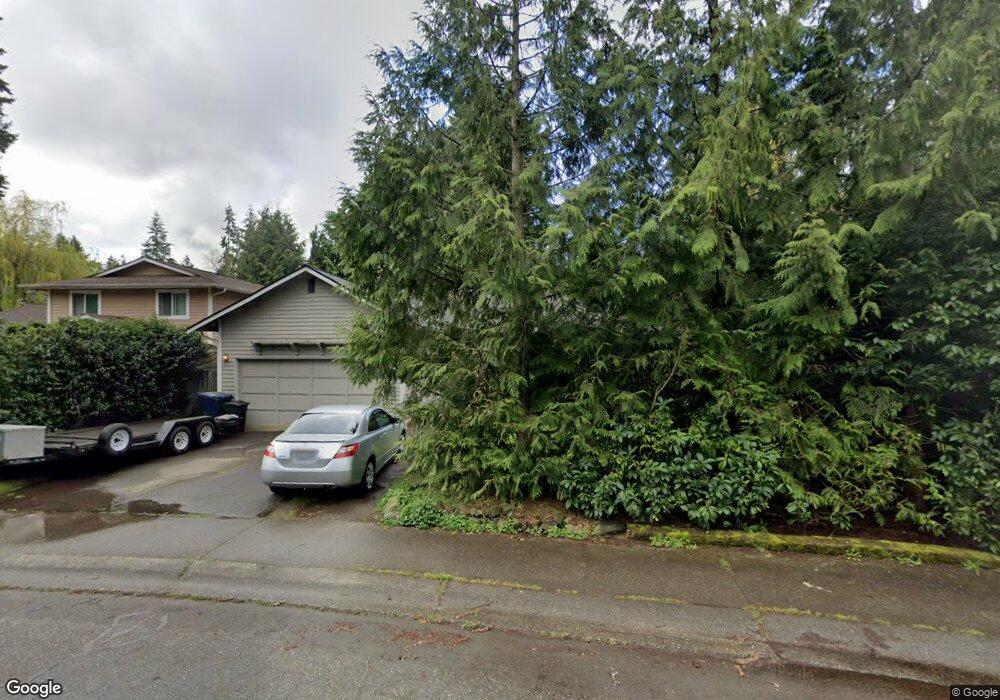
1710 174th Place SE Bothell, WA 98012
North Creek NeighborhoodEstimated Value: $731,895 - $872,000
3
Beds
2
Baths
1,417
Sq Ft
$557/Sq Ft
Est. Value
About This Home
This home is located at 1710 174th Place SE, Bothell, WA 98012 and is currently estimated at $789,224, approximately $556 per square foot. 1710 174th Place SE is a home located in Snohomish County with nearby schools including Woodside Elementary School, Heatherwood Middle School, and Henry M. Jackson High School.
Ownership History
Date
Name
Owned For
Owner Type
Purchase Details
Closed on
Dec 24, 2008
Sold by
Nupen Andrea L
Bought by
Nupen Brian D
Current Estimated Value
Home Financials for this Owner
Home Financials are based on the most recent Mortgage that was taken out on this home.
Original Mortgage
$299,653
Outstanding Balance
$182,974
Interest Rate
5.04%
Mortgage Type
FHA
Estimated Equity
$606,250
Purchase Details
Closed on
May 17, 2000
Sold by
Sellers Mark and Sellers Taunya
Bought by
Nupen Brian D and Nupen Andrea L
Home Financials for this Owner
Home Financials are based on the most recent Mortgage that was taken out on this home.
Original Mortgage
$195,691
Interest Rate
8.22%
Mortgage Type
FHA
Purchase Details
Closed on
Apr 21, 1995
Sold by
Harris Raymond L and Harris Tonya E
Bought by
Sellers Mark and Sellers Taunya
Home Financials for this Owner
Home Financials are based on the most recent Mortgage that was taken out on this home.
Original Mortgage
$138,139
Interest Rate
8.44%
Mortgage Type
FHA
Create a Home Valuation Report for This Property
The Home Valuation Report is an in-depth analysis detailing your home's value as well as a comparison with similar homes in the area
Home Values in the Area
Average Home Value in this Area
Purchase History
| Date | Buyer | Sale Price | Title Company |
|---|---|---|---|
| Nupen Brian D | $56,179 | Ticor Title Company | |
| Nupen Brian D | $197,000 | Chicago Title Insurance Co | |
| Sellers Mark | $140,000 | Transamerica Title Ins Co |
Source: Public Records
Mortgage History
| Date | Status | Borrower | Loan Amount |
|---|---|---|---|
| Open | Nupen Brian D | $299,653 | |
| Previous Owner | Nupen Brian D | $195,691 | |
| Previous Owner | Sellers Mark | $138,139 |
Source: Public Records
Tax History
| Year | Tax Paid | Tax Assessment Tax Assessment Total Assessment is a certain percentage of the fair market value that is determined by local assessors to be the total taxable value of land and additions on the property. | Land | Improvement |
|---|---|---|---|---|
| 2026 | $6,364 | $696,300 | $510,000 | $186,300 |
| 2025 | $5,905 | $656,200 | $475,000 | $181,200 |
| 2024 | $5,905 | $611,200 | $430,000 | $181,200 |
| 2023 | $6,249 | $709,900 | $505,000 | $204,900 |
| 2022 | $5,362 | $526,700 | $353,000 | $173,700 |
| 2020 | $5,206 | $429,800 | $280,000 | $149,800 |
| 2019 | $4,799 | $397,100 | $250,000 | $147,100 |
| 2018 | $4,427 | $333,100 | $200,000 | $133,100 |
| 2017 | $3,936 | $297,800 | $177,000 | $120,800 |
| 2016 | $3,433 | $272,300 | $157,000 | $115,300 |
| 2015 | $3,435 | $258,400 | $144,000 | $114,400 |
| 2013 | $2,842 | $188,100 | $96,000 | $92,100 |
Source: Public Records
Map
Nearby Homes
- 1815 172nd St SE
- 17529 Brook Blvd
- 1516 170th Place SE
- 16825 17th Ave SE
- 1325 Seattle Hill Rd Unit A2
- 1325 Seattle Hill Rd Unit A3
- 1325 Seattle Hill Rd Unit L2
- 1621 Seattle Hill Rd Unit HH-2
- 1621 Seattle Hill Rd Unit Q3
- 1621 Seattle Hill Rd Unit JJ-3
- 1621 Seattle Hill Rd Unit K4
- 1621 Seattle Hill Rd Unit J5
- 1621 Seattle Hill Rd Unit C4
- 1621 Seattle Hill Rd Unit u-1
- 18429 20th Dr SE
- 18323 10th Dr SE
- 2401 185th Place SE
- 18309 26th Dr SE
- 2502 166th Place SE
- 18719 12th Dr SE
- 1714 174th Place SE
- 1700 174th Place SE
- 1711 175th Place SE
- 1722 174th Place SE
- 1711 174th Place SE
- 1624 174th Place SE
- 1719 175th Place SE
- 1629 175th Place SE
- 1622 174th Place SE
- 1709 174th Place SE
- 1726 174th Place SE
- 1701 174th Place SE
- 21057 43rd (Lot 16) Dr SE
- 1621 175th Place SE
- 1727 175th Place SE
- 1730 174th Place SE
- 1723 174th Place SE
- 1707 174th Place SE
- 1703 174th Place SE
Your Personal Tour Guide
Ask me questions while you tour the home.