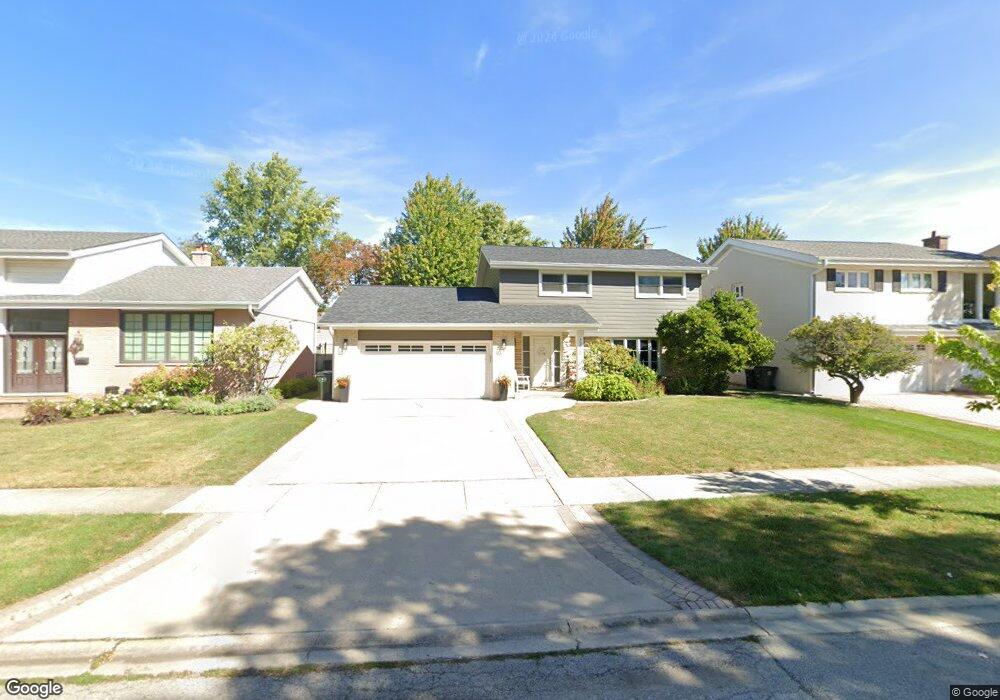
1710 Birch St Park Ridge, IL 60068
Estimated Value: $633,712 - $828,000
3
Beds
3
Baths
2,076
Sq Ft
$360/Sq Ft
Est. Value
About This Home
This home is located at 1710 Birch St, Park Ridge, IL 60068 and is currently estimated at $746,428, approximately $359 per square foot. 1710 Birch St is a home located in Cook County with nearby schools including Franklin Elementary School, Emerson Middle School, and Maine East High School.
Ownership History
Date
Name
Owned For
Owner Type
Purchase Details
Closed on
Sep 14, 2017
Sold by
Smith Deborah K
Bought by
Giannikoulis Konstantinos and Giannikoulis Catherine
Current Estimated Value
Home Financials for this Owner
Home Financials are based on the most recent Mortgage that was taken out on this home.
Original Mortgage
$424,100
Outstanding Balance
$353,868
Interest Rate
3.87%
Mortgage Type
New Conventional
Estimated Equity
$392,560
Purchase Details
Closed on
Aug 2, 2004
Sold by
Milito Ralph and Milito Kelly
Bought by
Smith Deborah K
Purchase Details
Closed on
Sep 21, 1998
Sold by
Bellas George
Bought by
Milito Ralph and Milito Kelly
Home Financials for this Owner
Home Financials are based on the most recent Mortgage that was taken out on this home.
Original Mortgage
$227,150
Interest Rate
6.9%
Create a Home Valuation Report for This Property
The Home Valuation Report is an in-depth analysis detailing your home's value as well as a comparison with similar homes in the area
Home Values in the Area
Average Home Value in this Area
Purchase History
| Date | Buyer | Sale Price | Title Company |
|---|---|---|---|
| Giannikoulis Konstantinos | $537,000 | Chicago Title | |
| Smith Deborah K | $597,500 | Pntn | |
| Milito Ralph | $305,000 | -- |
Source: Public Records
Mortgage History
| Date | Status | Borrower | Loan Amount |
|---|---|---|---|
| Open | Giannikoulis Konstantinos | $424,100 | |
| Previous Owner | Milito Ralph | $227,150 |
Source: Public Records
Tax History Compared to Growth
Tax History
| Year | Tax Paid | Tax Assessment Tax Assessment Total Assessment is a certain percentage of the fair market value that is determined by local assessors to be the total taxable value of land and additions on the property. | Land | Improvement |
|---|---|---|---|---|
| 2024 | $12,200 | $48,266 | $10,067 | $38,199 |
| 2023 | $11,662 | $48,266 | $10,067 | $38,199 |
| 2022 | $11,662 | $48,266 | $10,067 | $38,199 |
| 2021 | $11,403 | $40,824 | $7,163 | $33,661 |
| 2020 | $11,017 | $40,824 | $7,163 | $33,661 |
| 2019 | $10,929 | $45,361 | $7,163 | $38,198 |
| 2018 | $11,453 | $40,021 | $6,195 | $33,826 |
| 2017 | $10,442 | $40,021 | $6,195 | $33,826 |
| 2016 | $10,296 | $40,021 | $6,195 | $33,826 |
| 2015 | $9,828 | $34,489 | $5,420 | $29,069 |
| 2014 | $9,651 | $34,489 | $5,420 | $29,069 |
| 2013 | $9,124 | $34,489 | $5,420 | $29,069 |
Source: Public Records
Map
Nearby Homes
- 8253 N Western Ave
- 1819 Glenview Ave
- 1712 Woodland Ave
- 2200 Walnut St
- 1720 Greendale Ave
- 8619 W Park Ln
- 1044 N Knight Ave
- 1144 N Greenwood Ave
- 1025 N Knight Ave
- 1420 Oakton St
- 1717 Oakton St
- 1815 Oakton St Unit 2A
- 1035 N Dee Rd
- 8517 W Madison Dr
- 900 Rowe Ave
- 1710 Dempster St Unit A
- 907 Wilkinson Pkwy
- 2308 Oakton St
- 863 N Northwest Hwy
- 2200 Bouterse St Unit 409B