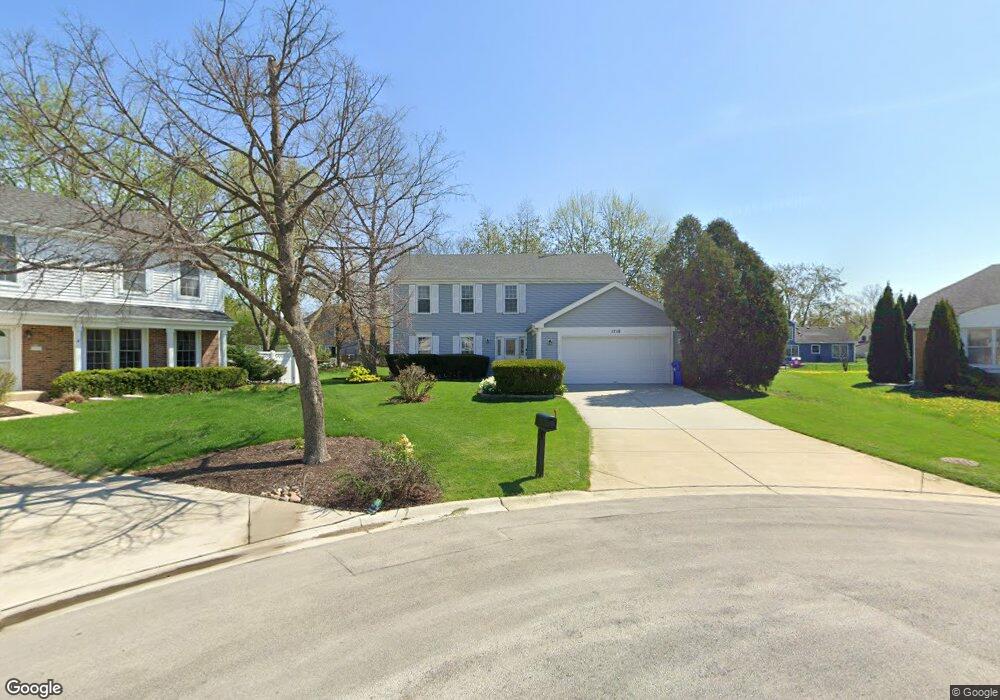
1710 Ivy Ct E Wheaton, IL 60189
Estimated Value: $539,482 - $636,000
4
Beds
3
Baths
2,444
Sq Ft
$244/Sq Ft
Est. Value
About This Home
This home is located at 1710 Ivy Ct E, Wheaton, IL 60189 and is currently estimated at $595,621, approximately $243 per square foot. 1710 Ivy Ct E is a home located in DuPage County with nearby schools including Arbor View Elementary School, Glen Crest Middle School, and Glenbard South High School.
Ownership History
Date
Name
Owned For
Owner Type
Purchase Details
Closed on
Feb 26, 2008
Sold by
Sunder Lalitha N and Lalitha N Sunder Revocable Tru
Bought by
Sunder Muthuswamy V and Muthuswamy V Sunder Revocable Trust
Current Estimated Value
Purchase Details
Closed on
Mar 17, 2003
Sold by
Sunder Muthuswamy V and Sunder Lalitha N
Bought by
Sunder Lalitha N and Lalitha N Sunder Revocable Trust
Create a Home Valuation Report for This Property
The Home Valuation Report is an in-depth analysis detailing your home's value as well as a comparison with similar homes in the area
Home Values in the Area
Average Home Value in this Area
Purchase History
| Date | Buyer | Sale Price | Title Company |
|---|---|---|---|
| Sunder Muthuswamy V | -- | None Available | |
| Sunder Lalitha N | -- | -- |
Source: Public Records
Tax History
| Year | Tax Paid | Tax Assessment Tax Assessment Total Assessment is a certain percentage of the fair market value that is determined by local assessors to be the total taxable value of land and additions on the property. | Land | Improvement |
|---|---|---|---|---|
| 2024 | $10,749 | $158,288 | $36,970 | $121,318 |
| 2023 | $10,215 | $145,700 | $34,030 | $111,670 |
| 2022 | $9,978 | $137,700 | $32,160 | $105,540 |
| 2021 | $9,971 | $134,440 | $31,400 | $103,040 |
| 2020 | $10,064 | $133,190 | $31,110 | $102,080 |
| 2019 | $9,794 | $129,680 | $30,290 | $99,390 |
| 2018 | $10,120 | $132,160 | $28,540 | $103,620 |
| 2017 | $9,406 | $127,290 | $27,490 | $99,800 |
| 2016 | $9,002 | $122,200 | $26,390 | $95,810 |
| 2015 | $8,465 | $111,380 | $25,180 | $86,200 |
| 2014 | $8,391 | $109,010 | $24,100 | $84,910 |
| 2013 | $8,137 | $109,330 | $24,170 | $85,160 |
Source: Public Records
Map
Nearby Homes
- 1580 College Ln S
- 1265 Windsor Dr
- 23W070 Mulberry Ln
- 23W160 Woodcroft Dr
- 1720 Lakecliffe Dr Unit A
- 2S744 Lakeside Dr Unit 21
- 3S481 Osage Dr
- 953 Cordova Ct
- 22W425 Arbor Ln
- 3S240 Burr Oak Dr
- 2266 Pebble Creek Dr
- 448 Raintree Ct Unit 1C
- 1129 Rhodes Ct
- 429 Sandhurst Cir Unit 1
- 453 Raintree Dr Unit 5A
- 453 Raintree Dr Unit 1H
- 1678 Groton Ct
- 30 Danada Dr
- 470 Fawell Blvd Unit 510
- 470 Fawell Blvd Unit 203
- 1709 Ivy Ct E
- 1700 Ivy Ct E
- 2170 Stirrup Ln
- 2154 Stirrup Ln
- 2160 Stirrup Ln
- 1690 Ivy Ct E Unit 4B
- 2174 Stirrup Ln
- 1689 Ivy Ct E
- 2150 Stirrup Ln
- 2178 Stirrup Ln
- 2146 Stirrup Ln
- 1669 Ivy Ct E
- 1670 Ivy Ct E
- 2142 Stirrup Ln
- 2201 Hiram Ct
- 2138 Stirrup Ln
- 2182 Stirrup Ln
- 1631 Ivy Ct E
- 1650 Ivy Ct E
- 2205 Hiram Ct
Your Personal Tour Guide
Ask me questions while you tour the home.