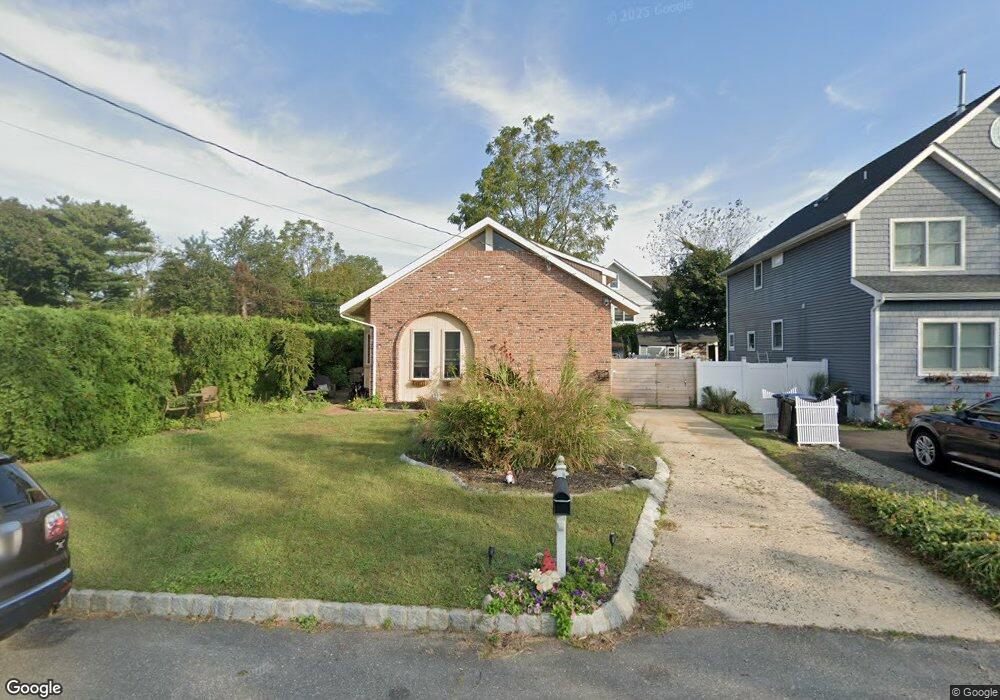
1710 Leslie St Wall Township, NJ 07719
Estimated Value: $623,000 - $681,000
3
Beds
3
Baths
1,325
Sq Ft
$498/Sq Ft
Est. Value
About This Home
This home is located at 1710 Leslie St, Wall Township, NJ 07719 and is currently estimated at $659,309, approximately $497 per square foot. 1710 Leslie St is a home located in Monmouth County with nearby schools including Wall High School, St. Rose Grammar School, and St Rose High School.
Ownership History
Date
Name
Owned For
Owner Type
Purchase Details
Closed on
Sep 5, 2008
Sold by
Stillwaggon Paul and Stillwagon Ruth
Bought by
Furey Kealan P
Current Estimated Value
Home Financials for this Owner
Home Financials are based on the most recent Mortgage that was taken out on this home.
Original Mortgage
$312,862
Outstanding Balance
$209,782
Interest Rate
6.69%
Mortgage Type
FHA
Estimated Equity
$449,527
Purchase Details
Closed on
Jul 31, 2003
Sold by
Kuhlthau Gail
Bought by
Stillwaggon Ruth
Home Financials for this Owner
Home Financials are based on the most recent Mortgage that was taken out on this home.
Original Mortgage
$214,900
Interest Rate
6.31%
Purchase Details
Closed on
Aug 30, 1999
Sold by
Castaldo Karen
Bought by
Kuhlthau Gail
Home Financials for this Owner
Home Financials are based on the most recent Mortgage that was taken out on this home.
Original Mortgage
$100,000
Interest Rate
7.5%
Create a Home Valuation Report for This Property
The Home Valuation Report is an in-depth analysis detailing your home's value as well as a comparison with similar homes in the area
Home Values in the Area
Average Home Value in this Area
Purchase History
| Date | Buyer | Sale Price | Title Company |
|---|---|---|---|
| Furey Kealan P | $324,000 | Fidelity Natl Title Ins Co | |
| Stillwaggon Ruth | $269,900 | -- | |
| Kuhlthau Gail | $160,000 | -- |
Source: Public Records
Mortgage History
| Date | Status | Borrower | Loan Amount |
|---|---|---|---|
| Open | Furey Kealan P | $312,862 | |
| Previous Owner | Stillwaggon Ruth | $214,900 | |
| Previous Owner | Kuhlthau Gail | $100,000 |
Source: Public Records
Tax History Compared to Growth
Tax History
| Year | Tax Paid | Tax Assessment Tax Assessment Total Assessment is a certain percentage of the fair market value that is determined by local assessors to be the total taxable value of land and additions on the property. | Land | Improvement |
|---|---|---|---|---|
| 2025 | $7,214 | $340,600 | $160,000 | $180,600 |
| 2024 | $7,044 | $340,600 | $160,000 | $180,600 |
| 2023 | $7,044 | $340,600 | $160,000 | $180,600 |
| 2022 | $6,836 | $340,600 | $160,000 | $180,600 |
| 2021 | $6,836 | $340,600 | $160,000 | $180,600 |
| 2020 | $6,734 | $340,600 | $160,000 | $180,600 |
| 2019 | $6,645 | $340,600 | $160,000 | $180,600 |
| 2018 | $6,587 | $340,600 | $160,000 | $180,600 |
| 2017 | $6,458 | $340,600 | $160,000 | $180,600 |
| 2016 | $6,339 | $340,600 | $160,000 | $180,600 |
| 2015 | $5,482 | $184,900 | $78,500 | $106,400 |
| 2014 | $5,107 | $176,400 | $70,000 | $106,400 |
Source: Public Records
Map
Nearby Homes
- 1770 Belmar Blvd
- 1425 Adrienne Rd
- 1706 Forest St
- 1624 Dumont Terrace
- 2123 Dumont Terrace
- 1335 State Route 138
- 1604 Marconi Rd
- 1727 Elizabeth Ct
- 1331 New Jersey 138
- 1407 Edgemere Rd
- 2501 Bedford Corners Ln Unit 11
- 1305 Squirrel Rd
- 2608 Garfield St
- 1890 Cleveland Ave
- 1213 17th Ave
- 1820 New Jersey 35 Unit 34
- 1826 New Bedford Rd
- 2628 E Hurley Pond Rd
- 1722 M St
- 2705 Buchanan St
- 1708 Leslie St
- 1716 Leslie St
- 1711 Maple St
- 1713 Maple St
- 1704 Leslie St
- 1709 Maple St
- 1709 Leslie St
- 1713 Leslie St
- 1717 Maple St
- 1705 Leslie St
- 1717 Leslie St
- 1703 Maple St
- 1702 Leslie St
- 1703 Leslie St
- 1706 Maple St
- 1710 Beverly St
- 1712 Beverly St
- 1706 Beverly St
- 1716 Beverly St
- 1707 Voorhees Ave