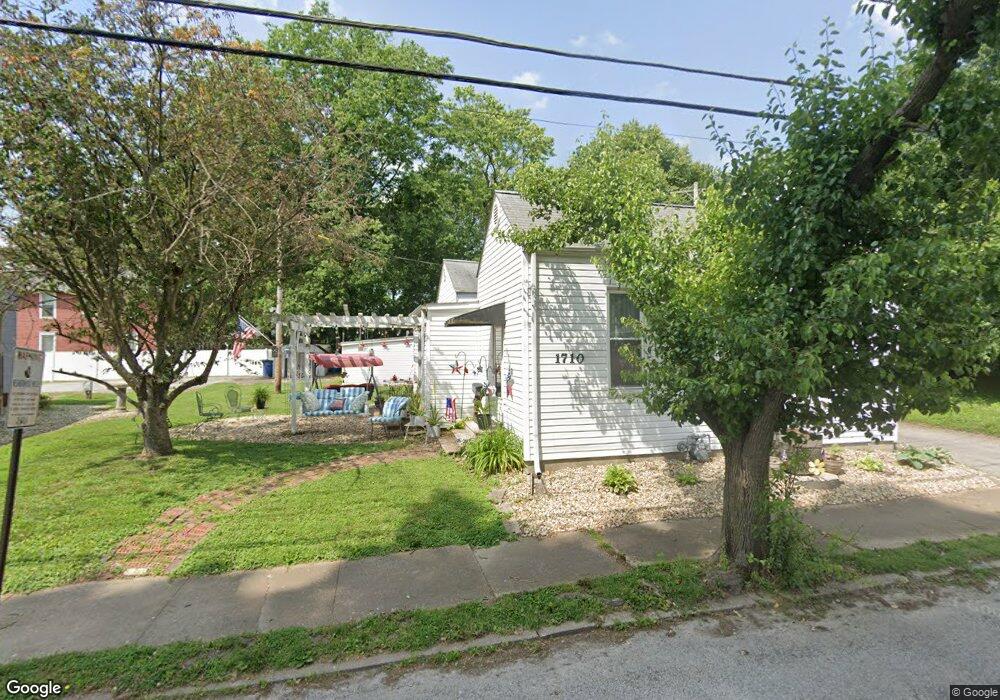
1710 Raab Ave Belleville, IL 62226
Estimated Value: $134,000 - $191,000
Studio
--
Bath
1,484
Sq Ft
$114/Sq Ft
Est. Value
About This Home
This home is located at 1710 Raab Ave, Belleville, IL 62226 and is currently estimated at $169,477, approximately $114 per square foot. 1710 Raab Ave is a home located in St. Clair County with nearby schools including Henry Raab Elementary School, Central Jr High School, and Governor French Academy.
Ownership History
Date
Name
Owned For
Owner Type
Purchase Details
Closed on
Jan 23, 2017
Sold by
Forsythe Clint and Forsythe Lindsay
Bought by
Forsythe Homes Llc
Current Estimated Value
Purchase Details
Closed on
Sep 30, 2014
Sold by
Brown Donald B and Brown Carol D
Bought by
Forsythe Clint D and Forsythe Lindsay L
Home Financials for this Owner
Home Financials are based on the most recent Mortgage that was taken out on this home.
Original Mortgage
$97,600
Interest Rate
4.75%
Mortgage Type
New Conventional
Purchase Details
Closed on
Jun 25, 2012
Sold by
Brown Donald B and Brown Carol D
Bought by
Brown Donald B and Brown Carol D
Create a Home Valuation Report for This Property
The Home Valuation Report is an in-depth analysis detailing your home's value as well as a comparison with similar homes in the area
Home Values in the Area
Average Home Value in this Area
Purchase History
| Date | Buyer | Sale Price | Title Company |
|---|---|---|---|
| Forsythe Homes Llc | -- | Attorney | |
| Forsythe Clint D | $122,000 | Community Title Shiloh Llc | |
| Brown Donald B | -- | None Available |
Source: Public Records
Mortgage History
| Date | Status | Borrower | Loan Amount |
|---|---|---|---|
| Closed | Forsythe Clint D | $97,600 |
Source: Public Records
Tax History
| Year | Tax Paid | Tax Assessment Tax Assessment Total Assessment is a certain percentage of the fair market value that is determined by local assessors to be the total taxable value of land and additions on the property. | Land | Improvement |
|---|---|---|---|---|
| 2024 | $5,248 | $59,674 | $4,287 | $55,387 |
| 2023 | $5,485 | $58,438 | $4,202 | $54,236 |
| 2022 | $5,035 | $52,609 | $3,783 | $48,826 |
| 2021 | $4,849 | $48,635 | $3,497 | $45,138 |
| 2020 | $4,713 | $45,992 | $3,307 | $42,685 |
| 2019 | $4,433 | $42,791 | $3,478 | $39,313 |
| 2018 | $4,335 | $41,866 | $3,403 | $38,463 |
| 2017 | $4,301 | $41,571 | $3,379 | $38,192 |
| 2016 | $4,247 | $40,688 | $3,307 | $37,381 |
| 2014 | $2,314 | $36,024 | $3,900 | $32,124 |
| 2013 | $3,000 | $36,539 | $3,956 | $32,583 |
Source: Public Records
Map
Nearby Homes
Your Personal Tour Guide
Ask me questions while you tour the home.