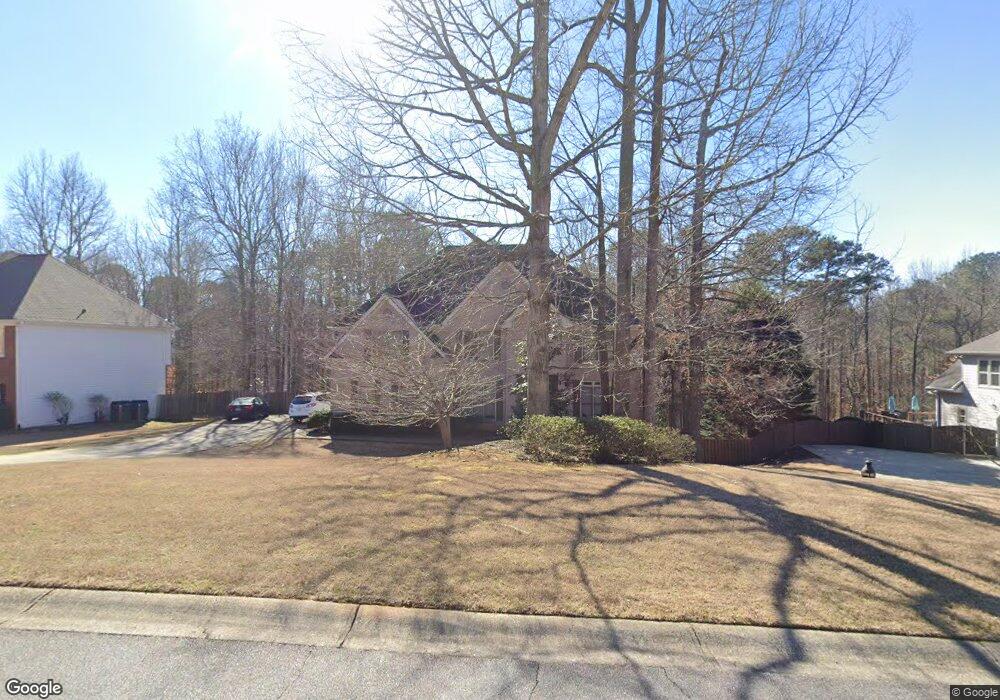
1710 Rising Mist Ln Cumming, GA 30041
Estimated Value: $631,000 - $765,000
4
Beds
4
Baths
2,751
Sq Ft
$246/Sq Ft
Est. Value
About This Home
This home is located at 1710 Rising Mist Ln, Cumming, GA 30041 and is currently estimated at $676,874, approximately $246 per square foot. 1710 Rising Mist Ln is a home located in Forsyth County with nearby schools including Mashburn Elementary School, Lakeside Middle School, and Forsyth Central High School.
Ownership History
Date
Name
Owned For
Owner Type
Purchase Details
Closed on
Jun 30, 2011
Sold by
Crum Dallas C
Bought by
Crum Kip
Current Estimated Value
Purchase Details
Closed on
Mar 21, 2008
Sold by
Thompson Chuck G and Thompson Bridget M
Bought by
Crum Dallas C
Home Financials for this Owner
Home Financials are based on the most recent Mortgage that was taken out on this home.
Original Mortgage
$243,600
Interest Rate
5.97%
Mortgage Type
FHA
Purchase Details
Closed on
Dec 17, 2003
Sold by
Boaz Lauri L
Bought by
Thompson Chuck G and Thompson Bridget
Home Financials for this Owner
Home Financials are based on the most recent Mortgage that was taken out on this home.
Original Mortgage
$290,750
Interest Rate
2.88%
Mortgage Type
New Conventional
Purchase Details
Closed on
Jun 13, 1997
Sold by
Tennyson Ent Inc
Bought by
Boaz Mark S and Boaz Lauri L
Home Financials for this Owner
Home Financials are based on the most recent Mortgage that was taken out on this home.
Original Mortgage
$240,000
Interest Rate
7.98%
Mortgage Type
New Conventional
Create a Home Valuation Report for This Property
The Home Valuation Report is an in-depth analysis detailing your home's value as well as a comparison with similar homes in the area
Home Values in the Area
Average Home Value in this Area
Purchase History
| Date | Buyer | Sale Price | Title Company |
|---|---|---|---|
| Crum Kip | $300,000 | -- | |
| Crum Dallas C | $300,000 | -- | |
| Thompson Chuck G | $306,100 | -- | |
| Boaz Mark S | $270,500 | -- |
Source: Public Records
Mortgage History
| Date | Status | Borrower | Loan Amount |
|---|---|---|---|
| Previous Owner | Crum Dallas C | $243,600 | |
| Previous Owner | Thompson Chuck G | $290,750 | |
| Previous Owner | Boaz Mark S | $240,000 |
Source: Public Records
Tax History Compared to Growth
Tax History
| Year | Tax Paid | Tax Assessment Tax Assessment Total Assessment is a certain percentage of the fair market value that is determined by local assessors to be the total taxable value of land and additions on the property. | Land | Improvement |
|---|---|---|---|---|
| 2025 | $6,312 | $251,524 | $76,000 | $175,524 |
| 2024 | $6,312 | $257,416 | $72,000 | $185,416 |
| 2023 | $5,717 | $232,260 | $52,800 | $179,460 |
| 2022 | $4,726 | $153,020 | $38,000 | $115,020 |
| 2021 | $4,226 | $153,020 | $38,000 | $115,020 |
| 2020 | $4,205 | $152,280 | $30,800 | $121,480 |
| 2019 | $3,849 | $139,180 | $26,000 | $113,180 |
| 2018 | $4,054 | $146,600 | $26,000 | $120,600 |
| 2017 | $3,285 | $118,344 | $26,000 | $92,344 |
| 2016 | $3,285 | $118,344 | $26,000 | $92,344 |
| 2015 | $3,290 | $118,344 | $26,000 | $92,344 |
| 2014 | $2,554 | $96,484 | $0 | $0 |
Source: Public Records
Map
Nearby Homes
- 3560 Sky Ln
- 3640 Sky Ln
- 1540 Turner Rd
- 1345 Starboard Way
- 1130 S Rudder Rd
- 1325 Starboard Way
- 1125 Lanier Place
- 2555 Chattahoochee Ln
- 1755 Falcon Creek Trail
- 1269 Windmill Pkwy
- 1250 Winterhaven Dr
- St. Ives Plan at The Parc at Caney
- Chatham Place Plan at The Parc at Caney
- Wingate Plan at Rose Creek
- Turnberry Park Plan at The Parc at Caney
- Continental Plan at Rose Creek
- Heritage Manor Plan at The Parc at Caney
- Woodward Plan at Rose Creek
- Riverton Plan at Rose Creek
- 1225 Westshore Dr
- 1720 Rising Mist Ln
- 1690 Rising Mist Ln
- 1680 Rising Mist Ln
- 1710 Admirals Point
- 1710 Admirals Pointe
- 1730 Rising Mist Ln
- 1715 Admirals Pointe
- 1670 Rising Mist Ln
- 1730 Admirals Pointe
- 0 Rising Mist Ln Unit 8936711
- 0 Rising Mist Ln Unit 7058504
- 0 Rising Mist Ln Unit 8657317
- 0 Rising Mist Ln Unit 8603110
- 0 Rising Mist Ln Unit 8457037
- 0 Rising Mist Ln Unit 8342904
- 0 Rising Mist Ln Unit 7603009
- 0 Rising Mist Ln Unit 7167309
- 1735 Rising Mist Ln
- 1740 Rising Mist Ln