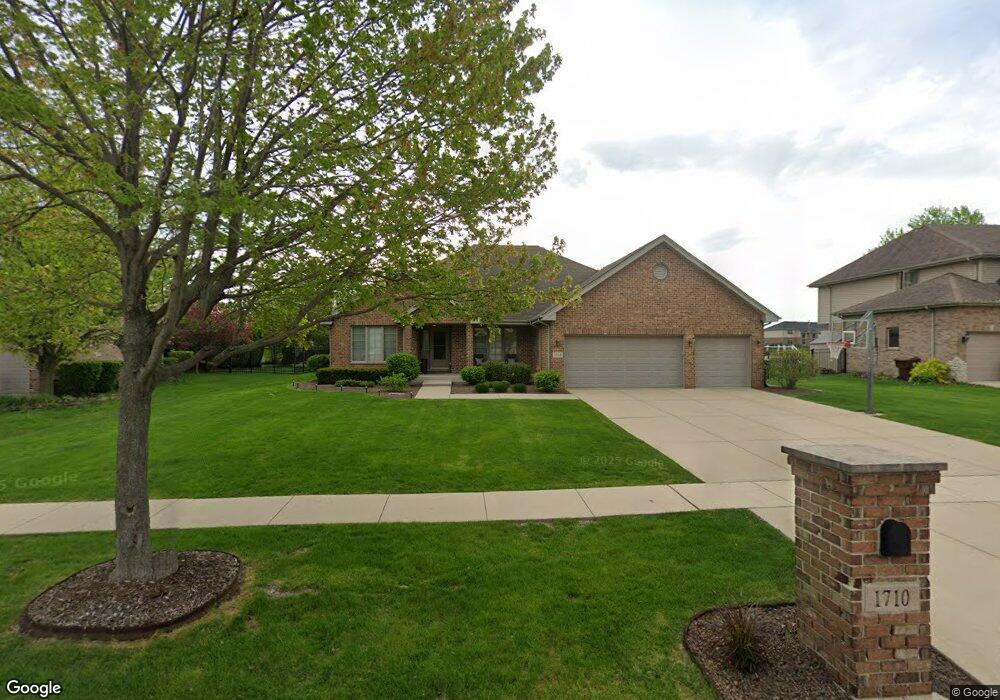
1710 S Regan Rd New Lenox, IL 60451
Estimated Value: $476,525 - $555,000
3
Beds
--
Bath
--
Sq Ft
0.29
Acres
About This Home
This home is located at 1710 S Regan Rd, New Lenox, IL 60451 and is currently estimated at $518,631. 1710 S Regan Rd is a home located in Will County with nearby schools including Oster-Oakview School, Haines Elementary School, and Lincoln Way West.
Ownership History
Date
Name
Owned For
Owner Type
Purchase Details
Closed on
Sep 6, 2016
Sold by
Giordano Frank W and Giordano Christine M
Bought by
Swedko Ryan and Swedko Jennifer
Current Estimated Value
Purchase Details
Closed on
Mar 17, 2005
Sold by
Lewellen Home Builders
Bought by
Queen Bean Inc
Home Financials for this Owner
Home Financials are based on the most recent Mortgage that was taken out on this home.
Original Mortgage
$261,900
Interest Rate
5.64%
Mortgage Type
Fannie Mae Freddie Mac
Purchase Details
Closed on
Mar 11, 2005
Sold by
Timber Mill Construction
Bought by
Giordano Frank W
Home Financials for this Owner
Home Financials are based on the most recent Mortgage that was taken out on this home.
Original Mortgage
$261,900
Interest Rate
5.64%
Mortgage Type
Fannie Mae Freddie Mac
Create a Home Valuation Report for This Property
The Home Valuation Report is an in-depth analysis detailing your home's value as well as a comparison with similar homes in the area
Home Values in the Area
Average Home Value in this Area
Purchase History
| Date | Buyer | Sale Price | Title Company |
|---|---|---|---|
| Swedko Ryan | $340,000 | Citywide Title Corporation | |
| Queen Bean Inc | -- | Chicago Title Insurance Comp | |
| Giordano Frank W | $327,500 | Chicago Title Insurance Co | |
| Timber Mill Construction | -- | Chicago Title Insurance Comp |
Source: Public Records
Mortgage History
| Date | Status | Borrower | Loan Amount |
|---|---|---|---|
| Previous Owner | Giordano Frank W | $261,900 |
Source: Public Records
Tax History Compared to Growth
Tax History
| Year | Tax Paid | Tax Assessment Tax Assessment Total Assessment is a certain percentage of the fair market value that is determined by local assessors to be the total taxable value of land and additions on the property. | Land | Improvement |
|---|---|---|---|---|
| 2024 | $11,829 | $153,762 | $36,940 | $116,822 |
| 2023 | $11,829 | $140,166 | $33,674 | $106,492 |
| 2022 | $10,654 | $129,126 | $31,022 | $98,104 |
| 2021 | $10,117 | $121,439 | $29,175 | $92,264 |
| 2020 | $9,832 | $117,106 | $28,134 | $88,972 |
| 2019 | $9,412 | $113,475 | $27,262 | $86,213 |
| 2018 | $9,196 | $109,565 | $26,323 | $83,242 |
| 2017 | $8,740 | $106,415 | $25,566 | $80,849 |
| 2016 | $8,486 | $103,567 | $24,882 | $78,685 |
| 2015 | $8,218 | $100,307 | $24,099 | $76,208 |
| 2014 | $8,218 | $99,068 | $23,801 | $75,267 |
| 2013 | $8,218 | $100,404 | $24,122 | $76,282 |
Source: Public Records
Map
Nearby Homes
- 1920 Edmonds Ave
- 13420 Florence Rd
- Lot 108 S Richard Ave
- 1261 S Regan Rd
- Lot 122 S Lynn Pkwy
- 13621 W Maple Rd
- 0000 W Regan Rd
- 13741 Elizabeth Ln
- 208 Redwood Ave
- 807 Picardy Place
- 200 Redwood Ave
- 12001 W Route 6
- 1344 N Cedar Rd
- 1108 Plaza Dr
- 18400 S Parker Rd
- 18670 S Cornflower Ct
- 1231 Town Crest Dr Unit E
- Will Cook Rd.+ Southwest Hwy
- 224 Hauser Ct
- 12932 Carrington Ct
- 1736 S Regan Rd
- 1680 S Regan Rd
- 1766 S Regan Rd
- 1660 S Regan Rd
- 1703 S Regan Rd
- 1743 S Regan Rd
- 885 Stirrup Ln
- 1640 S Regan Rd
- 1800 Edmond Ave
- 1796 S Regan Rd
- 871 Stirrup Ln
- 1800 Edmonds Ave
- 1705 London Rd
- 1780 Edmond Ave
- 1731 London Rd
- 1620 S Regan Rd
- 1780 Edmonds Ave
- 857 Stirrup Ln
- 1757 London Rd
- 1689 London Rd