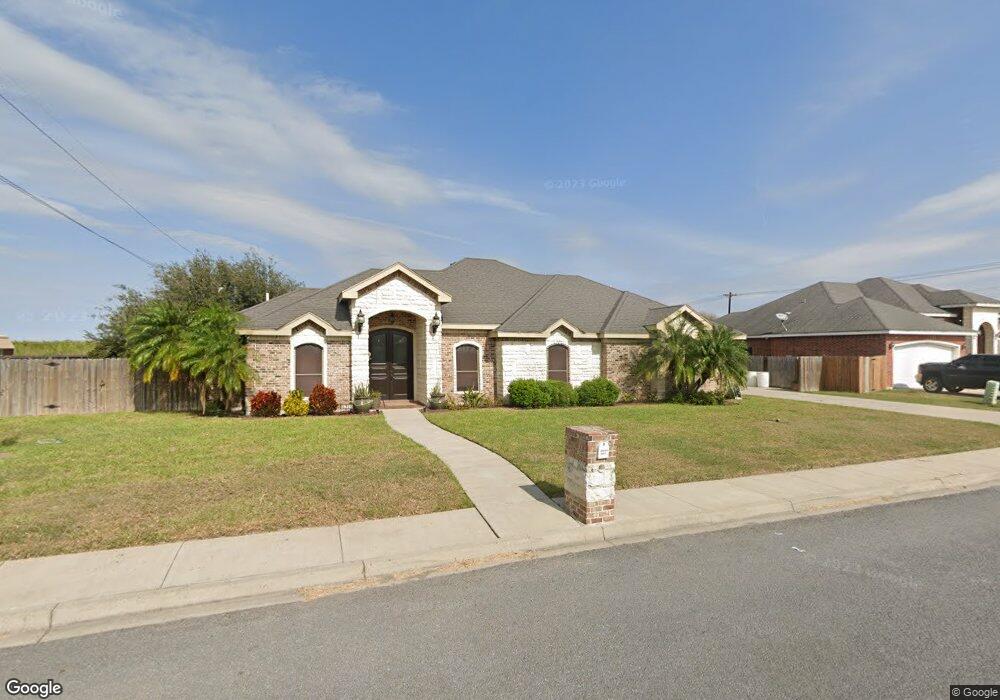
1710 Stuart Rd Weslaco, TX 78599
Estimated Value: $137,000 - $320,000
3
Beds
2
Baths
1,692
Sq Ft
$148/Sq Ft
Est. Value
About This Home
This home is located at 1710 Stuart Rd, Weslaco, TX 78599 and is currently estimated at $250,737, approximately $148 per square foot. 1710 Stuart Rd is a home located in Hidalgo County with nearby schools including Rodolfo Rudy Silva Jr. Elementary School, Beatriz G. Garza Middle School, and Weslaco High School.
Ownership History
Date
Name
Owned For
Owner Type
Purchase Details
Closed on
Jun 2, 2009
Sold by
Rci Development Terry Ltd
Bought by
Perales Oscar and Perales Olga
Current Estimated Value
Home Financials for this Owner
Home Financials are based on the most recent Mortgage that was taken out on this home.
Original Mortgage
$145,980
Outstanding Balance
$92,580
Interest Rate
4.84%
Mortgage Type
Purchase Money Mortgage
Estimated Equity
$158,157
Purchase Details
Closed on
Feb 3, 2009
Sold by
Zamora Flor Estela and Zamora Lizette
Bought by
Rci Development Terry Ltd
Purchase Details
Closed on
Apr 17, 2006
Sold by
Rci Development Terry Ltd
Bought by
Zamora Flor Estela
Home Financials for this Owner
Home Financials are based on the most recent Mortgage that was taken out on this home.
Original Mortgage
$26,900
Interest Rate
6.33%
Mortgage Type
Purchase Money Mortgage
Create a Home Valuation Report for This Property
The Home Valuation Report is an in-depth analysis detailing your home's value as well as a comparison with similar homes in the area
Home Values in the Area
Average Home Value in this Area
Purchase History
| Date | Buyer | Sale Price | Title Company |
|---|---|---|---|
| Perales Oscar | -- | Edwards Abstract | |
| Rci Development Terry Ltd | $24,000 | None Available | |
| Zamora Flor Estela | -- | None Available |
Source: Public Records
Mortgage History
| Date | Status | Borrower | Loan Amount |
|---|---|---|---|
| Open | Perales Oscar | $145,980 | |
| Previous Owner | Zamora Flor Estela | $26,900 |
Source: Public Records
Tax History Compared to Growth
Tax History
| Year | Tax Paid | Tax Assessment Tax Assessment Total Assessment is a certain percentage of the fair market value that is determined by local assessors to be the total taxable value of land and additions on the property. | Land | Improvement |
|---|---|---|---|---|
| 2025 | $3,576 | $265,741 | -- | -- |
| 2024 | $3,576 | $241,583 | -- | -- |
| 2023 | $4,080 | $219,621 | $70,723 | $148,898 |
| 2022 | $3,900 | $207,204 | $0 | $0 |
| 2021 | $3,621 | $188,367 | $41,255 | $147,112 |
| 2020 | $3,515 | $176,536 | $41,255 | $135,281 |
| 2019 | $3,590 | $172,482 | $41,255 | $131,227 |
| 2018 | $3,629 | $173,909 | $41,255 | $132,654 |
| 2017 | $3,645 | $175,336 | $41,255 | $134,081 |
| 2016 | $3,675 | $176,762 | $41,255 | $135,507 |
| 2015 | $3,320 | $178,188 | $41,255 | $136,933 |
Source: Public Records
Map
Nearby Homes
- 1414 Navel St
- 1308 Navel St
- 111 Troy Ave
- 5621 N Mile 6 W
- 1901 W Mile 11 N
- 1236 Chloe Rae Cir
- 1/2 S Mile 11 W
- 2909 W Mile 11 N
- 5608 Addison Ln
- 1014 Highland Ave
- 5510 Addison Ln
- 1104 Sofia St
- 2501 Kingdom Dr
- 5407 Common Ln
- 2261 Victoriano St
- 5605 Aaron Ln
- 2817 Las Nubes
- 2802 Stone Oak Dr
- 5386 Aaron Ln
- 5446 Jay Ln
- 1706 Stuart Rd
- 1709 Stuart Rd
- 1808 Stuart Rd
- 1705 Stuart Rd
- 1807 Stuart Rd
- 1807 Stuart Rd Unit JIM
- 1812 Stuart Rd
- 1603 Stuart Rd
- 0 Mile 6 W
- 00 Mile 6 W
- 1811 Stuart Rd
- 1910 Stuart Rd
- 1910 Stuart Rd Unit JIM
- 1806 Celeste St
- 1709 Celeste
- 1806 Celeste
- 1909 Stuart Rd
- 6108 N Mile 6 W
- 1810 Celeste
- 1914 Stuart Rd