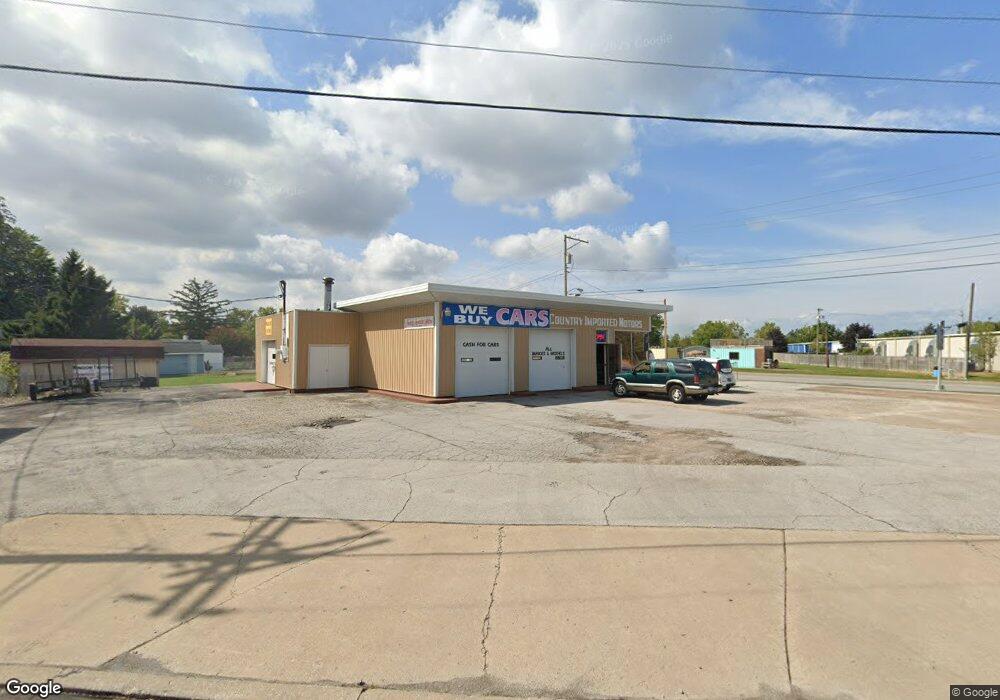
1710 Tiffin Ave Sandusky, OH 44870
--
Bed
--
Bath
2,415
Sq Ft
0.4
Acres
About This Home
This home is located at 1710 Tiffin Ave, Sandusky, OH 44870. 1710 Tiffin Ave is a home located in Erie County with nearby schools including Sandusky High School, Monroe Preparatory Academy, and Sandusky Central Catholic School.
Ownership History
Date
Name
Owned For
Owner Type
Purchase Details
Closed on
Nov 18, 2017
Sold by
Weiss E Eric
Bought by
Weiss E Eric and Weiss Vicki D
Purchase Details
Closed on
Mar 21, 2011
Sold by
Weiss E Eric and Zorn Vicki D
Bought by
Department Of Transportation
Purchase Details
Closed on
Dec 21, 2010
Sold by
Rose Land & Finance Corp
Bought by
Weiss E Eric
Purchase Details
Closed on
Dec 1, 2010
Sold by
Rose Acceptance Inc
Bought by
Rose Land & Finance Corp
Purchase Details
Closed on
Aug 12, 2010
Sold by
Pendergrass Susan E
Bought by
Rose Acceptance Inc
Purchase Details
Closed on
Feb 1, 2001
Sold by
Pitsenbarger Bill R
Bought by
Discount Muffler & Brake
Home Financials for this Owner
Home Financials are based on the most recent Mortgage that was taken out on this home.
Original Mortgage
$117,950
Interest Rate
7.22%
Mortgage Type
Commercial
Create a Home Valuation Report for This Property
The Home Valuation Report is an in-depth analysis detailing your home's value as well as a comparison with similar homes in the area
Home Values in the Area
Average Home Value in this Area
Purchase History
| Date | Buyer | Sale Price | Title Company |
|---|---|---|---|
| Weiss E Eric | -- | None Available | |
| Department Of Transportation | $6,350 | Attorney | |
| Weiss E Eric | $55,000 | Southern Title | |
| Rose Land & Finance Corp | -- | Southern Title | |
| Rose Acceptance Inc | $58,000 | None Available | |
| Discount Muffler & Brake | $105,000 | -- |
Source: Public Records
Mortgage History
| Date | Status | Borrower | Loan Amount |
|---|---|---|---|
| Previous Owner | Discount Muffler & Brake | $117,950 |
Source: Public Records
Tax History Compared to Growth
Tax History
| Year | Tax Paid | Tax Assessment Tax Assessment Total Assessment is a certain percentage of the fair market value that is determined by local assessors to be the total taxable value of land and additions on the property. | Land | Improvement |
|---|---|---|---|---|
| 2024 | $937 | $16,365 | $4,238 | $12,127 |
| 2023 | $937 | $16,134 | $3,531 | $12,603 |
| 2022 | $1,110 | $16,134 | $3,531 | $12,603 |
| 2021 | $1,174 | $16,130 | $3,530 | $12,600 |
| 2020 | $1,072 | $15,020 | $3,530 | $11,490 |
| 2019 | $1,093 | $15,020 | $3,530 | $11,490 |
| 2018 | $1,086 | $15,020 | $3,530 | $11,490 |
| 2017 | $1,271 | $17,240 | $3,530 | $13,710 |
| 2016 | $1,267 | $17,240 | $3,530 | $13,710 |
| 2015 | $1,179 | $17,240 | $3,530 | $13,710 |
| 2014 | $1,560 | $22,600 | $10,830 | $11,770 |
| 2013 | $1,555 | $22,600 | $10,830 | $11,770 |
Source: Public Records
Map
Nearby Homes
- 2002 Wilson St
- 0 Ohio 101
- 2234 Wilbert St
- 1805 Mills St
- 1 Perkins Ave
- 1319 Tiffin Ave
- 1725 Buchanan St
- 1318 Mills St
- 1014 Jay St
- 2219 Karl Ann Dr
- 2028 W Forest Dr
- 1608 Pierce St
- 1813 Sandusky St
- 2145 W Forest Dr
- 1017 Putnam St
- 1417 Pierce St
- 2614 Tiffin Ave
- 2614 Tiffin Ave Unit 103
- 1413 Seneca St
- 1311 Filmore St
- 1716 Tiffin Ave
- 1720 Tiffin Ave
- 1905 Sanford St
- 1905 Sanford St
- 1737 Tiffin Ave
- 1900 Wilson St
- 1902 Wilson St
- 1743 Tiffin Ave
- 1909 Sanford St
- 1745 Tiffin Ave
- 1910 Wilson St
- 2530 Venice Rd
- 1907 Wilson St
- 1913 Sanford St
- 1803 Tiffin Ave
- 1812 Tiffin Ave
- 1923 Sanford St
- 1926 Wilson St
- 1813 Tiffin Ave
- 1927 Wilson St