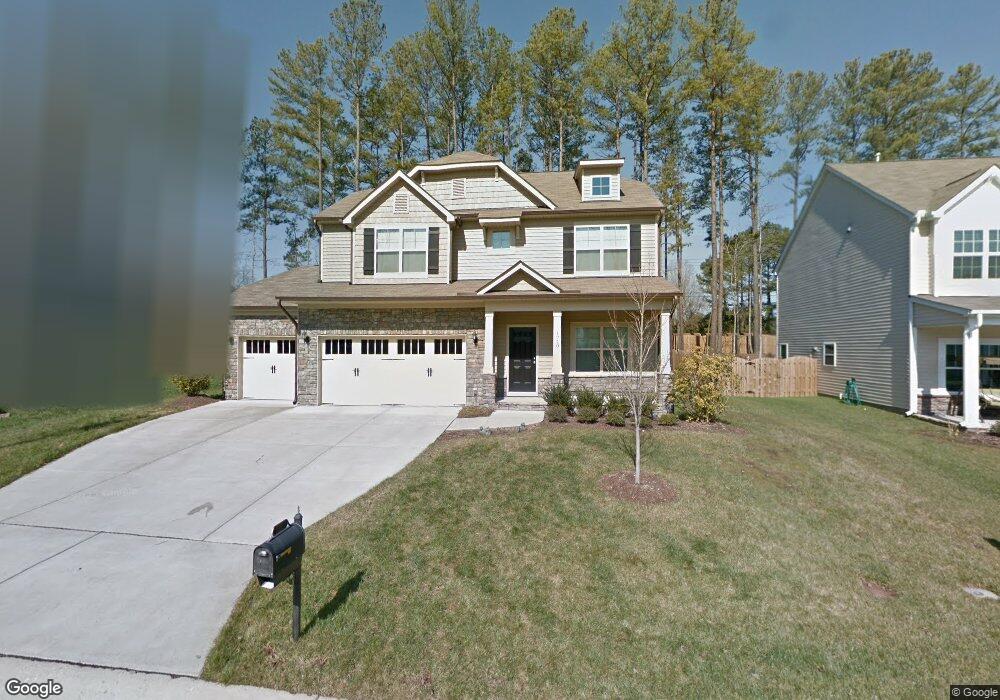
1710 Waddell Ct Durham, NC 27703
Eastern Durham NeighborhoodEstimated Value: $561,926 - $651,000
4
Beds
4
Baths
2,881
Sq Ft
$214/Sq Ft
Est. Value
About This Home
This home is located at 1710 Waddell Ct, Durham, NC 27703 and is currently estimated at $615,732, approximately $213 per square foot. 1710 Waddell Ct is a home located in Durham County with nearby schools including Spring Valley Elementary School, John W Neal Middle School, and Southern School of Energy & Sustainability.
Ownership History
Date
Name
Owned For
Owner Type
Purchase Details
Closed on
Dec 19, 2018
Sold by
Vaughan Bradley A
Bought by
Vaughan Bradley A and Vaughan Kristy
Current Estimated Value
Home Financials for this Owner
Home Financials are based on the most recent Mortgage that was taken out on this home.
Original Mortgage
$62,980
Outstanding Balance
$48,135
Interest Rate
4.9%
Mortgage Type
Stand Alone Second
Estimated Equity
$567,597
Purchase Details
Closed on
Feb 27, 2014
Sold by
D R Horton Inc
Bought by
Vaughan Bradley A
Home Financials for this Owner
Home Financials are based on the most recent Mortgage that was taken out on this home.
Original Mortgage
$279,837
Outstanding Balance
$212,589
Interest Rate
4.4%
Mortgage Type
FHA
Estimated Equity
$403,143
Purchase Details
Closed on
Jan 22, 2013
Sold by
Mrec Brightleaf Llc
Bought by
D R Horton Inc and Nance John
Create a Home Valuation Report for This Property
The Home Valuation Report is an in-depth analysis detailing your home's value as well as a comparison with similar homes in the area
Home Values in the Area
Average Home Value in this Area
Purchase History
| Date | Buyer | Sale Price | Title Company |
|---|---|---|---|
| Vaughan Bradley A | -- | Servicelink Title Only | |
| Vaughan Bradley A | $285,000 | None Available | |
| D R Horton Inc | $183,000 | None Available |
Source: Public Records
Mortgage History
| Date | Status | Borrower | Loan Amount |
|---|---|---|---|
| Open | Vaughan Bradley A | $62,980 | |
| Open | Vaughan Bradley A | $279,837 |
Source: Public Records
Tax History Compared to Growth
Tax History
| Year | Tax Paid | Tax Assessment Tax Assessment Total Assessment is a certain percentage of the fair market value that is determined by local assessors to be the total taxable value of land and additions on the property. | Land | Improvement |
|---|---|---|---|---|
| 2025 | $4,781 | $606,349 | $110,250 | $496,099 |
| 2024 | $4,781 | $342,732 | $63,100 | $279,632 |
| 2023 | $4,489 | $342,732 | $63,100 | $279,632 |
| 2022 | $4,387 | $342,732 | $63,100 | $279,632 |
| 2021 | $4,366 | $342,732 | $63,100 | $279,632 |
| 2020 | $4,263 | $342,732 | $63,100 | $279,632 |
| 2019 | $4,263 | $342,732 | $63,100 | $279,632 |
| 2018 | $4,438 | $327,170 | $63,100 | $264,070 |
| 2017 | $4,405 | $327,170 | $63,100 | $264,070 |
| 2016 | $4,257 | $327,170 | $63,100 | $264,070 |
| 2015 | $4,330 | $312,824 | $79,343 | $233,481 |
| 2014 | $4,330 | $312,824 | $79,343 | $233,481 |
Source: Public Records
Map
Nearby Homes
- 1613 Waddell Ct
- 200 Callandale Ln
- 1821 S Mineral Springs Rd
- 533 Kings Lake Way
- 1607 Willowcrest Rd
- 543 Callandale Ln
- 140 Token House Rd
- 4 Seawell Ct
- 1602 Eagle Lodge Ln
- 144 Daneborg Rd
- 110 Elmsford St
- 104 Elmsford St
- 148 Daneborg Rd
- Winstead III Plan at Mica Ridge - Sterling Collection
- Nelson Plan at Mica Ridge - Sterling Collection
- Somerset III Plan at Mica Ridge - Sterling Collection
- 3465 Delmar Dr
- 3463 Delmar Dr
- 3459 Delmar Dr
- 3457 Delmar Dr
- 1712 Waddell Ct
- 1708 Waddell Ct
- 1714 Waddell Ct
- 1706 Waddell Ct
- 1709 Waddell Ct
- 1707 Waddell Ct
- 1716 Waddell Ct
- 1705 Waddell Ct
- 1705 Waddell Ct Unit 1176
- 1714 Sherron Rd
- 1704 Waddell Ct
- 1704 Waddell Ct Unit 1158
- 1612 Pattersons Mill Rd
- 1610 Pattersons Mill Rd
- 1703 Waddell Ct
- 1614 Pattersons Mill Rd
- 1608 Pattersons Mill Rd
- 1718 Waddell Ct
- 1702 Waddell Ct
- 1701 Waddell Ct