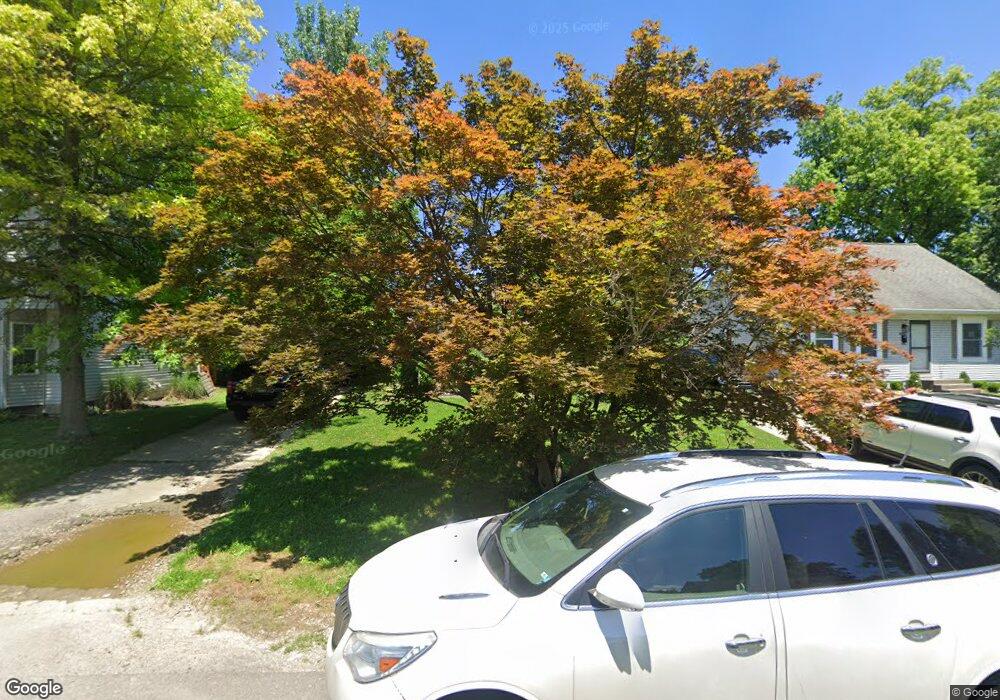
1710 Ward Rd Columbus, OH 43224
North Linden NeighborhoodEstimated Value: $177,000 - $247,000
3
Beds
2
Baths
1,275
Sq Ft
$156/Sq Ft
Est. Value
About This Home
This home is located at 1710 Ward Rd, Columbus, OH 43224 and is currently estimated at $199,100, approximately $156 per square foot. 1710 Ward Rd is a home located in Franklin County with nearby schools including North Linden Elementary School, Medina Middle School, and Mifflin High School.
Ownership History
Date
Name
Owned For
Owner Type
Purchase Details
Closed on
Jun 23, 2014
Sold by
Schoenman Mary C K and Schoenman Ryan
Bought by
Schoenman Mary C K
Current Estimated Value
Home Financials for this Owner
Home Financials are based on the most recent Mortgage that was taken out on this home.
Original Mortgage
$88,255
Outstanding Balance
$67,729
Interest Rate
4.75%
Mortgage Type
FHA
Estimated Equity
$131,371
Purchase Details
Closed on
Jun 20, 2008
Sold by
An Jak Properties Llc
Bought by
Kristop Mary C
Home Financials for this Owner
Home Financials are based on the most recent Mortgage that was taken out on this home.
Original Mortgage
$96,485
Interest Rate
6.1%
Mortgage Type
FHA
Purchase Details
Closed on
Nov 5, 2007
Sold by
Home Network Solutions Ltd
Bought by
Am Jak Properties Llc
Purchase Details
Closed on
Aug 10, 1990
Bought by
Smith Glendal S
Purchase Details
Closed on
Mar 6, 1990
Purchase Details
Closed on
Oct 5, 1988
Create a Home Valuation Report for This Property
The Home Valuation Report is an in-depth analysis detailing your home's value as well as a comparison with similar homes in the area
Home Values in the Area
Average Home Value in this Area
Purchase History
| Date | Buyer | Sale Price | Title Company |
|---|---|---|---|
| Schoenman Mary C K | -- | None Available | |
| Kristop Mary C | $98,000 | Chicago Tit | |
| Am Jak Properties Llc | $34,000 | Premiere Ti | |
| Home Networks Solutions Ltd | $14,400 | Premiere Ti | |
| Smith Glendal S | -- | -- | |
| -- | -- | -- | |
| -- | $46,900 | -- |
Source: Public Records
Mortgage History
| Date | Status | Borrower | Loan Amount |
|---|---|---|---|
| Open | Schoenman Mary C K | $88,255 | |
| Closed | Kristop Mary C | $96,485 |
Source: Public Records
Tax History
| Year | Tax Paid | Tax Assessment Tax Assessment Total Assessment is a certain percentage of the fair market value that is determined by local assessors to be the total taxable value of land and additions on the property. | Land | Improvement |
|---|---|---|---|---|
| 2025 | $2,560 | $57,050 | $16,100 | $40,950 |
| 2024 | $2,560 | $57,050 | $16,100 | $40,950 |
| 2023 | $2,528 | $57,050 | $16,100 | $40,950 |
| 2022 | $1,454 | $28,040 | $5,360 | $22,680 |
| 2021 | $1,705 | $28,040 | $5,360 | $22,680 |
| 2020 | $1,459 | $28,040 | $5,360 | $22,680 |
| 2019 | $1,312 | $21,630 | $4,270 | $17,360 |
| 2018 | $1,423 | $21,630 | $4,270 | $17,360 |
| 2017 | $1,311 | $21,630 | $4,270 | $17,360 |
| 2016 | $1,710 | $25,560 | $3,470 | $22,090 |
| 2015 | $1,549 | $25,560 | $3,470 | $22,090 |
| 2014 | $1,541 | $25,560 | $3,470 | $22,090 |
| 2013 | $844 | $28,385 | $3,850 | $24,535 |
Source: Public Records
Map
Nearby Homes
- 1863 Ward Rd
- 4143 Karl Rd Unit 215
- 4143 Karl Rd Unit 314
- 4145 Karl Rd Unit 223
- 1936 Case Rd
- 3967 Karl Rd Unit 224
- 3939 Karl Rd Unit 311
- 2023 Ferris Rd
- 3941 Karl Rd Unit 133
- 3750 Dresden St
- 2045 Sale Rd
- 2081 Ormond Ave
- 2196 Ferris Rd
- 2010 Melrose Ave
- 3583 Dresden St
- 3620 Walmar Dr
- 2267 Ferris Rd
- 3585 Gerbert Rd
- 2299 Belcher Dr
- 2298 Belcher Dr
Your Personal Tour Guide
Ask me questions while you tour the home.