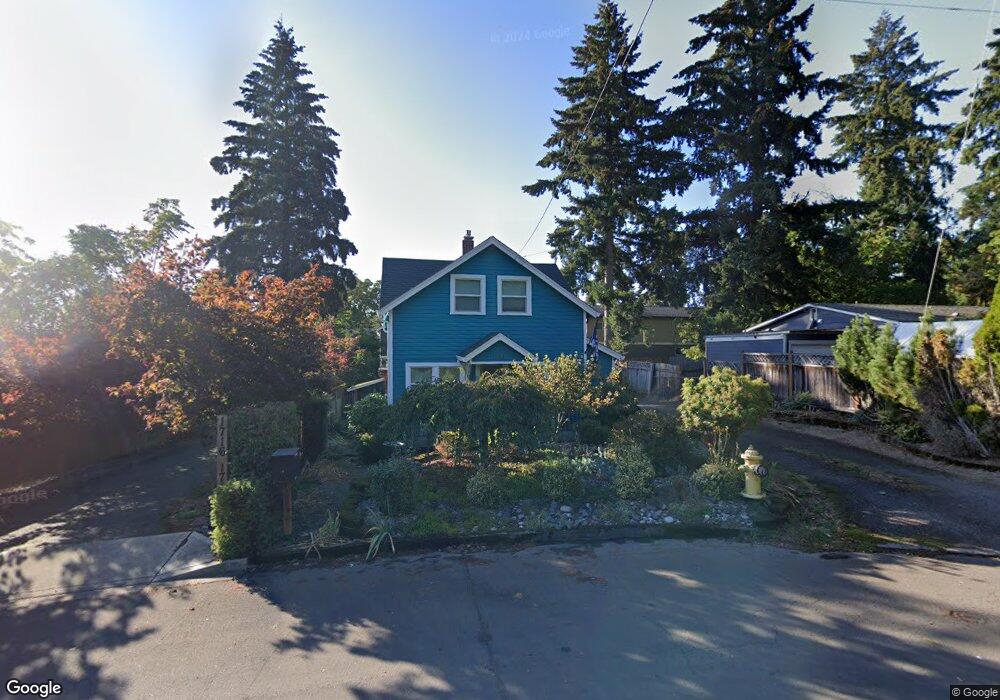
1710 X St Vancouver, WA 98661
Central Park NeighborhoodEstimated Value: $430,000 - $456,000
2
Beds
3
Baths
1,652
Sq Ft
$267/Sq Ft
Est. Value
About This Home
This home is located at 1710 X St, Vancouver, WA 98661 and is currently estimated at $441,149, approximately $267 per square foot. 1710 X St is a home located in Clark County with nearby schools including Harney Elementary School, Discovery Middle School, and Hudson's Bay High School.
Ownership History
Date
Name
Owned For
Owner Type
Purchase Details
Closed on
Jan 28, 2009
Sold by
Clark County Rentals Llc
Bought by
Bray Devon A and Bray Amanda D
Current Estimated Value
Home Financials for this Owner
Home Financials are based on the most recent Mortgage that was taken out on this home.
Original Mortgage
$195,087
Outstanding Balance
$123,582
Interest Rate
5.14%
Mortgage Type
FHA
Estimated Equity
$317,567
Purchase Details
Closed on
Apr 16, 2008
Sold by
Anderton Allen K
Bought by
Clark County Rentals Llc
Purchase Details
Closed on
Nov 1, 2007
Sold by
Anderton Christina
Bought by
Anderton Allen K
Home Financials for this Owner
Home Financials are based on the most recent Mortgage that was taken out on this home.
Original Mortgage
$154,000
Interest Rate
6.29%
Mortgage Type
Unknown
Create a Home Valuation Report for This Property
The Home Valuation Report is an in-depth analysis detailing your home's value as well as a comparison with similar homes in the area
Home Values in the Area
Average Home Value in this Area
Purchase History
| Date | Buyer | Sale Price | Title Company |
|---|---|---|---|
| Bray Devon A | $201,824 | Stewart Title | |
| Clark County Rentals Llc | -- | None Available | |
| Anderton Allen K | -- | Columbia Title Agency | |
| Anderton Allen K | $192,500 | Columbia Title Agency |
Source: Public Records
Mortgage History
| Date | Status | Borrower | Loan Amount |
|---|---|---|---|
| Open | Bray Devon A | $195,087 | |
| Previous Owner | Anderton Allen K | $154,000 |
Source: Public Records
Tax History Compared to Growth
Tax History
| Year | Tax Paid | Tax Assessment Tax Assessment Total Assessment is a certain percentage of the fair market value that is determined by local assessors to be the total taxable value of land and additions on the property. | Land | Improvement |
|---|---|---|---|---|
| 2025 | $3,954 | $418,559 | $157,658 | $260,901 |
| 2024 | $3,963 | $404,746 | $157,658 | $247,088 |
| 2023 | $3,715 | $423,525 | $164,824 | $258,701 |
| 2022 | $3,578 | $398,607 | $160,524 | $238,083 |
| 2021 | $3,553 | $357,632 | $143,325 | $214,307 |
| 2020 | $3,223 | $334,760 | $121,478 | $213,282 |
| 2019 | $2,858 | $314,705 | $105,281 | $209,424 |
| 2018 | $3,016 | $289,053 | $0 | $0 |
| 2017 | $2,578 | $253,254 | $0 | $0 |
| 2016 | $2,464 | $225,879 | $0 | $0 |
| 2015 | $2,336 | $206,321 | $0 | $0 |
| 2014 | -- | $184,873 | $0 | $0 |
| 2013 | -- | $156,613 | $0 | $0 |
Source: Public Records
Map
Nearby Homes
- 1518 Z St
- 1418 Grand Place
- 2764 E Mcloughlin Blvd Unit 2764
- 2772 E Mcloughlin Blvd
- 2210 E 25th St
- 2809 E 24th St
- 2611 E 26th St
- 2502 E 27th St
- 2618 E 27th St
- 3306 E 17th St
- 3313 E 17th St
- 1511 June Dr
- 1515 June Dr
- 2001 E Evergreen Blvd Unit 2001
- 3400 E 13th St
- 3000 Grand Blvd
- 2605 E 6th St
- 3100 T St
- 3000 R St
- 3504 E 12th St