Estimated Value: $112,585 - $162,000
3
Beds
1
Bath
1,210
Sq Ft
$105/Sq Ft
Est. Value
About This Home
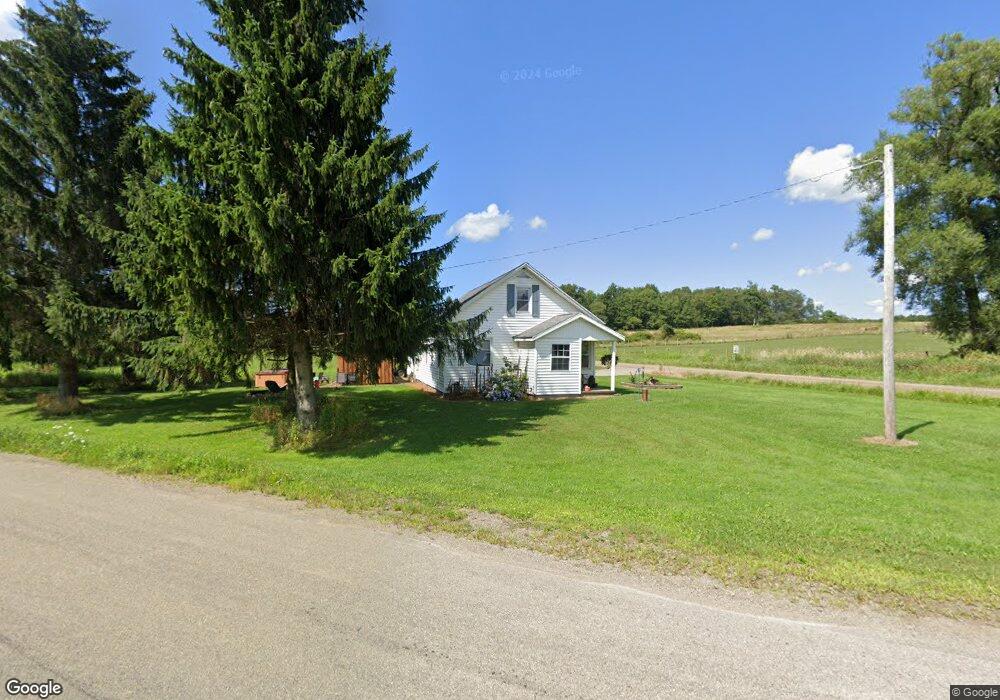
This home is located at 17100 Buffalo Rd, Corry, PA 16407 and is currently estimated at $127,646, approximately $105 per square foot. 17100 Buffalo Rd is a home located in Erie County with nearby schools including Corry Area Primary School, Corry Area Intermediate School, and Corry Area Middle School.
Ownership History
Date
Name
Owned For
Owner Type
Purchase Details
Closed on
Dec 23, 2024
Sold by
Savko John A and Savko Kathleen M
Bought by
Savko John M and Savko Mark A
Current Estimated Value
Purchase Details
Closed on
Feb 1, 2012
Sold by
Halfast Jason D and Halfast Angela
Bought by
Savko John A and Savko Kathleen M
Home Financials for this Owner
Home Financials are based on the most recent Mortgage that was taken out on this home.
Original Mortgage
$26,000
Interest Rate
3.92%
Mortgage Type
Seller Take Back
Purchase Details
Closed on
Dec 22, 2004
Sold by
Steele Sharon
Bought by
Halfast Jason D
Home Financials for this Owner
Home Financials are based on the most recent Mortgage that was taken out on this home.
Original Mortgage
$22,000
Interest Rate
5.16%
Mortgage Type
Purchase Money Mortgage
Purchase Details
Closed on
Dec 7, 2001
Sold by
Skalos Joseph
Bought by
Steele Sharon
Purchase Details
Closed on
Feb 8, 2001
Sold by
Skalos Joseph and Glavis June
Bought by
Skalos Joseph
Create a Home Valuation Report for This Property
The Home Valuation Report is an in-depth analysis detailing your home's value as well as a comparison with similar homes in the area
Purchase History
| Date | Buyer | Sale Price | Title Company |
|---|---|---|---|
| Savko John M | -- | None Listed On Document | |
| Savko John M | -- | None Listed On Document | |
| Savko John A | $54,000 | None Available | |
| Halfast Jason D | $27,000 | -- | |
| Steele Sharon | -- | -- | |
| Skalos Joseph | -- | -- |
Source: Public Records
Mortgage History
| Date | Status | Borrower | Loan Amount |
|---|---|---|---|
| Previous Owner | Savko John A | $26,000 | |
| Previous Owner | Halfast Jason D | $22,000 |
Source: Public Records
Tax History Compared to Growth
Tax History
| Year | Tax Paid | Tax Assessment Tax Assessment Total Assessment is a certain percentage of the fair market value that is determined by local assessors to be the total taxable value of land and additions on the property. | Land | Improvement |
|---|---|---|---|---|
| 2025 | $1,274 | $54,000 | $10,500 | $43,500 |
| 2024 | $1,262 | $54,000 | $10,500 | $43,500 |
| 2023 | $1,219 | $54,000 | $10,500 | $43,500 |
| 2022 | $1,187 | $54,000 | $10,500 | $43,500 |
| 2021 | $1,175 | $54,000 | $10,500 | $43,500 |
| 2020 | $1,162 | $54,000 | $10,500 | $43,500 |
| 2019 | $1,135 | $54,000 | $10,500 | $43,500 |
| 2018 | $1,113 | $54,000 | $10,500 | $43,500 |
| 2017 | $1,086 | $54,000 | $10,500 | $43,500 |
| 2016 | $1,356 | $54,000 | $10,500 | $43,500 |
| 2015 | $1,342 | $54,000 | $10,500 | $43,500 |
| 2014 | $599 | $54,000 | $10,500 | $43,500 |
Source: Public Records
Map
Nearby Homes
- 11500 Ladd Rd
- 0 New Buffalo Rd
- 0 Cabbage Hill Rd Unit R1504313
- 12250 U S 6
- 1249 White St
- 978 Mead Ave
- 0 Stewart Hill Rd
- 820 Mead Ave
- 318 Worth St
- 837 Us Highway 6
- 0 Country Club - Road Lots 6 7 & 8 Rd Unit 187274
- 538 Grand St
- 27 W Frederick St
- 503 W Washington St
- 110-118 W Smith and 307 Grace St
- 144 Wright St
- 115 Maple Ave
- 124 Lemon St
- 132 Random Rd
- 8714 Knowlton Rd