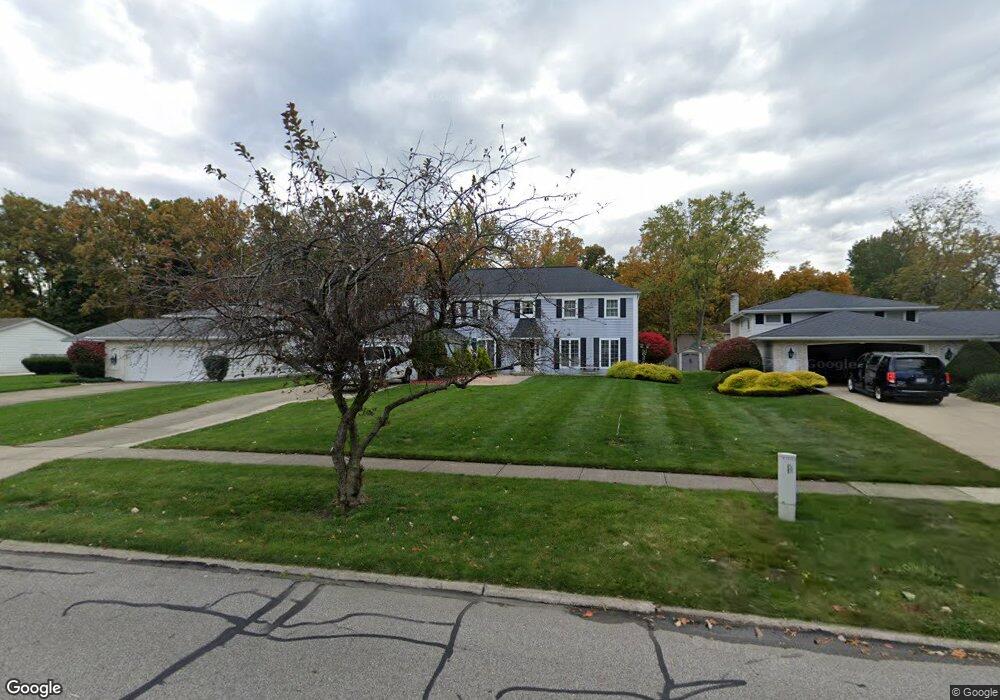
17101 Hunting Meadows Dr Strongsville, OH 44136
Estimated Value: $368,000 - $410,000
4
Beds
3
Baths
2,792
Sq Ft
$139/Sq Ft
Est. Value
About This Home
This home is located at 17101 Hunting Meadows Dr, Strongsville, OH 44136 and is currently estimated at $386,926, approximately $138 per square foot. 17101 Hunting Meadows Dr is a home located in Cuyahoga County with nearby schools including Strongsville High School and Sts Joseph & John Interparochial School.
Ownership History
Date
Name
Owned For
Owner Type
Purchase Details
Closed on
Feb 25, 2015
Sold by
Zhuravlyov Denis and Bun Jeannette S
Bought by
Bun Roath S and Chrin Phallika
Current Estimated Value
Purchase Details
Closed on
Apr 29, 2009
Sold by
Kobe Jeffrey A and Kobe Maureen E
Bought by
Bun Roath S and Zhuravlyov Denys
Home Financials for this Owner
Home Financials are based on the most recent Mortgage that was taken out on this home.
Original Mortgage
$168,396
Outstanding Balance
$107,537
Interest Rate
5.05%
Mortgage Type
FHA
Estimated Equity
$279,389
Purchase Details
Closed on
Dec 21, 1992
Sold by
Roman Judith A
Bought by
Kobe Jeffrey A
Purchase Details
Closed on
Mar 27, 1989
Sold by
Roman Robert J
Bought by
Roman Judith A
Purchase Details
Closed on
Jan 15, 1987
Sold by
Roman Robert J and J A
Bought by
Roman Robert J
Purchase Details
Closed on
Jan 1, 1975
Bought by
Roman Robert J and J A
Create a Home Valuation Report for This Property
The Home Valuation Report is an in-depth analysis detailing your home's value as well as a comparison with similar homes in the area
Home Values in the Area
Average Home Value in this Area
Purchase History
| Date | Buyer | Sale Price | Title Company |
|---|---|---|---|
| Bun Roath S | -- | Chicago Title Insurance Co | |
| Bun Roath S | $188,500 | Chicago Title Insurance Co | |
| Kobe Jeffrey A | $158,500 | -- | |
| Roman Judith A | -- | -- | |
| Roman Robert J | -- | -- | |
| Roman Robert J | -- | -- |
Source: Public Records
Mortgage History
| Date | Status | Borrower | Loan Amount |
|---|---|---|---|
| Open | Bun Roath S | $168,396 |
Source: Public Records
Tax History Compared to Growth
Tax History
| Year | Tax Paid | Tax Assessment Tax Assessment Total Assessment is a certain percentage of the fair market value that is determined by local assessors to be the total taxable value of land and additions on the property. | Land | Improvement |
|---|---|---|---|---|
| 2024 | $4,879 | $103,915 | $21,700 | $82,215 |
| 2023 | $4,843 | $77,350 | $18,270 | $59,080 |
| 2022 | $4,808 | $77,350 | $18,270 | $59,080 |
| 2021 | $4,770 | $77,350 | $18,270 | $59,080 |
| 2020 | $4,421 | $63,420 | $14,980 | $48,440 |
| 2019 | $4,291 | $181,200 | $42,800 | $138,400 |
| 2018 | $3,848 | $63,420 | $14,980 | $48,440 |
| 2017 | $3,773 | $56,880 | $12,110 | $44,770 |
| 2016 | $3,743 | $56,880 | $12,110 | $44,770 |
| 2015 | -- | $56,880 | $12,110 | $44,770 |
| 2014 | -- | $56,880 | $12,110 | $44,770 |
Source: Public Records
Map
Nearby Homes
- 17069 Partridge Dr
- 18162 Fawn Cir
- 18630 Shurmer Rd
- 17024 Bear Creek Ln
- 16650 Lanier Ave
- 19311 Bradford Ct
- 17682 Drake Rd
- 18294 Drake Rd
- 17159 Turkey Meadow Ln
- 19297 Lauren Way
- 17934 Cambridge Oval
- 17259 Woodshire Dr
- 19513 Lunn Rd
- 15639 Indianhead Ln
- 16450 Howe Rd
- 14826 Lenox Dr
- 14703 Lenox Dr Unit 103
- 18411 Yorktown Oval
- 19160 Wheelers Ln
- 19908 Stoughton Dr
- 17097 Hunting Meadows Dr
- 17105 Hunting Meadows Dr
- 17091 Hunting Meadows Dr
- 17068 Partridge Dr
- 17062 Partridge Dr
- 17076 Partridge Dr
- 17058 Partridge Dr
- 17082 Partridge Dr
- 17087 Hunting Meadows Dr
- 17100 Hunting Meadows Dr
- 17109 Hunting Meadows Dr
- 17098 Hunting Meadows Dr
- 17106 Hunting Meadows Dr
- 17052 Partridge Dr
- 17090 Partridge Dr
- 17092 Hunting Meadows Dr
- 17083 Hunting Meadows Dr
- 17110 Hunting Meadows Dr
- 17111 Hunting Meadows Dr
- 17088 Hunting Meadows Dr