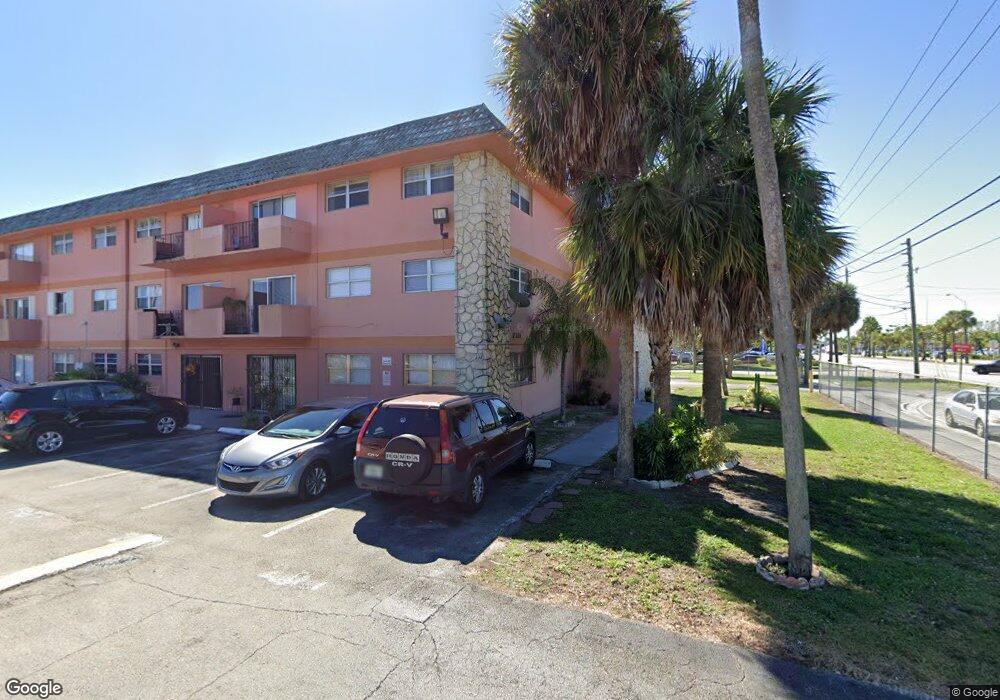
17101 NW 57 Ave Unit 118 Miami, FL 33015
Carol City NeighborhoodEstimated Value: $183,000 - $240,590
2
Beds
2
Baths
875
Sq Ft
$241/Sq Ft
Est. Value
About This Home
This home is located at 17101 NW 57 Ave Unit 118, Miami, FL 33015 and is currently estimated at $210,898, approximately $241 per square foot. 17101 NW 57 Ave Unit 118 is a home located in Miami-Dade County with nearby schools including North Glade Elementary School, Lake Stevens Middle School, and Miami Carol City Senior High School.
Ownership History
Date
Name
Owned For
Owner Type
Purchase Details
Closed on
Dec 26, 2012
Sold by
Merchant Farzana
Bought by
Merchant Farzana
Current Estimated Value
Purchase Details
Closed on
Jul 16, 2009
Sold by
Wells Fargo Bank Na
Bought by
Merchant Farzana
Purchase Details
Closed on
Sep 25, 2008
Sold by
Rodriguez Andres Dejesus and Toston Gil Angela
Bought by
Wells Fargo Bank Na
Purchase Details
Closed on
Nov 20, 2006
Sold by
Moran Pedro and Moran Maria A
Bought by
Dejesus Rodriguez Andres and Toston Gil Angela
Home Financials for this Owner
Home Financials are based on the most recent Mortgage that was taken out on this home.
Original Mortgage
$137,750
Interest Rate
6.06%
Mortgage Type
Balloon
Purchase Details
Closed on
Jun 19, 2002
Sold by
Jerome J Landy M and Jerome Gayle J
Bought by
Moran Pedro and Moran Maria A
Create a Home Valuation Report for This Property
The Home Valuation Report is an in-depth analysis detailing your home's value as well as a comparison with similar homes in the area
Home Values in the Area
Average Home Value in this Area
Purchase History
| Date | Buyer | Sale Price | Title Company |
|---|---|---|---|
| Merchant Farzana | -- | None Available | |
| Merchant Farzana | $55,125 | Attorney | |
| Wells Fargo Bank Na | -- | None Available | |
| Dejesus Rodriguez Andres | $145,000 | Attorney | |
| Moran Pedro | $71,500 | -- |
Source: Public Records
Mortgage History
| Date | Status | Borrower | Loan Amount |
|---|---|---|---|
| Previous Owner | Dejesus Rodriguez Andres | $137,750 |
Source: Public Records
Tax History Compared to Growth
Tax History
| Year | Tax Paid | Tax Assessment Tax Assessment Total Assessment is a certain percentage of the fair market value that is determined by local assessors to be the total taxable value of land and additions on the property. | Land | Improvement |
|---|---|---|---|---|
| 2025 | $2,497 | $124,817 | -- | -- |
| 2024 | $2,088 | $113,470 | -- | -- |
| 2023 | $2,088 | $103,155 | $0 | $0 |
| 2022 | $1,854 | $93,778 | $0 | $0 |
| 2021 | $1,618 | $85,253 | $0 | $0 |
| 2020 | $1,536 | $100,052 | $0 | $0 |
| 2019 | $1,466 | $100,052 | $0 | $0 |
| 2018 | $1,376 | $103,146 | $0 | $0 |
| 2017 | $1,270 | $58,230 | $0 | $0 |
| 2016 | $985 | $52,937 | $0 | $0 |
| 2015 | $968 | $49,585 | $0 | $0 |
| 2014 | $902 | $45,078 | $0 | $0 |
Source: Public Records
Map
Nearby Homes
- 17101 NW 57th Ave Unit 314
- 17101 NW 57th Ave Unit 110
- 16700 NW 55th Ave Unit 12
- 17231 NW 53rd Place
- 17340 NW 52nd Place
- 17298 NW 60th Ct
- 17270 NW 60th Ct
- 17254 NW 60th Ct
- 17311 NW 52nd Ave
- 17130 NW 51st Place
- 6169 NW 170th Terrace
- 17352 NW 61st Ct S
- 5020 NW 170th St
- 17532 NW 61st Ct N
- 17353 NW 62nd Ct
- 0 NW 167th St & Gardner Rd Unit HMS2585165
- 5420 NW 182nd St
- 6243 NW 171st St
- 5111 NW 178th Terrace
- 4932 NW 173rd Dr
- 17101 NW 57th Ave Unit 17101
- 17101 NW 57th Ave Unit 219
- 17101 NW 57th Ave Unit 207
- 17101 NW 57th Ave Unit 118
- 17101 NW 57th Ave Unit 302
- 17101 NW 57th Ave Unit 318
- 17101 NW 57th Ave Unit 106
- 17101 NW 57th Ave Unit 307
- 17101 NW 57th Ave Unit 309
- 17101 NW 57th Ave Unit 217
- 17101 NW 57th Ave Unit 111
- 17101 NW 57th Ave Unit 316
- 17101 NW 57th Ave Unit 319
- 17101 NW 57th Ave Unit 315
- 17101 NW 57th Ave Unit 206
- 17101 NW 57th Ave Unit 103
- 17101 NW 57th Ave Unit 101
- 17101 NW 57th Ave Unit 209