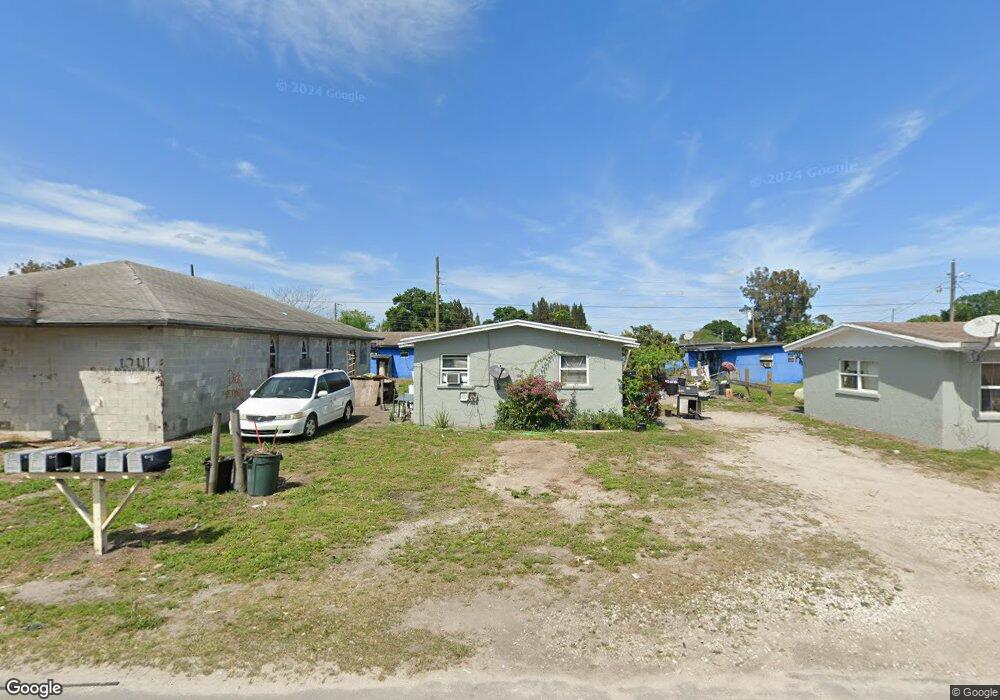
17101 SW Magnolia St Unit 17103 Indiantown, FL 34956
Estimated Value: $96,000 - $173,000
2
Beds
2
Baths
800
Sq Ft
$182/Sq Ft
Est. Value
About This Home
This home is located at 17101 SW Magnolia St Unit 17103, Indiantown, FL 34956 and is currently estimated at $145,667, approximately $182 per square foot. 17101 SW Magnolia St Unit 17103 is a home located in Martin County with nearby schools including Warfield Elementary School, Indiantown Middle School, and South Fork High School.
Ownership History
Date
Name
Owned For
Owner Type
Purchase Details
Closed on
Apr 25, 2023
Sold by
Booker Park Community Development Corp
Bought by
A & S Properties Fl Llc
Current Estimated Value
Purchase Details
Closed on
Jan 9, 2013
Sold by
Cb International Investments Llc
Bought by
Booker Park Community Development Corp
Purchase Details
Closed on
Feb 27, 2012
Sold by
County Of Martin
Bought by
Cb International Inv Llc
Purchase Details
Closed on
Jul 7, 2005
Sold by
Mack Coreatha
Bought by
Mack Coreatha
Purchase Details
Closed on
Jun 20, 2002
Sold by
Delions Diane and Moore Diane
Bought by
Moore Jackie
Purchase Details
Closed on
Jan 28, 2002
Sold by
Perry Lizzie
Bought by
Evergreen First Baptist Church
Purchase Details
Closed on
Jul 31, 1995
Sold by
Webb Curtis and Webb Daisy
Bought by
Moore Diane
Purchase Details
Closed on
Jul 29, 1995
Sold by
Harkness Leonard
Bought by
Moore Diane
Purchase Details
Closed on
Jun 1, 1995
Sold by
Fayson Earl
Bought by
Moore Diane
Create a Home Valuation Report for This Property
The Home Valuation Report is an in-depth analysis detailing your home's value as well as a comparison with similar homes in the area
Home Values in the Area
Average Home Value in this Area
Purchase History
| Date | Buyer | Sale Price | Title Company |
|---|---|---|---|
| A & S Properties Fl Llc | $575,000 | None Listed On Document | |
| Booker Park Community Development Corp | $19,000 | Titlemark Of South Tampa Llc | |
| Cb International Inv Llc | $9,244 | None Available | |
| Mack Coreatha | -- | -- | |
| Moore Jackie | -- | -- | |
| Evergreen First Baptist Church | $6,000 | -- | |
| Moore Diane | -- | -- | |
| Moore Diane | -- | -- | |
| Moore Diane | -- | -- | |
| Moore Diane | -- | -- |
Source: Public Records
Tax History Compared to Growth
Tax History
| Year | Tax Paid | Tax Assessment Tax Assessment Total Assessment is a certain percentage of the fair market value that is determined by local assessors to be the total taxable value of land and additions on the property. | Land | Improvement |
|---|---|---|---|---|
| 2025 | $3,508 | $137,640 | $100,000 | $37,640 |
| 2024 | $1,975 | $150,150 | $150,150 | $40,150 |
| 2023 | $1,975 | $52,350 | $0 | $0 |
| 2022 | $1,752 | $47,591 | $0 | $0 |
| 2021 | $1,596 | $43,265 | $0 | $0 |
| 2020 | $1,384 | $45,480 | $18,000 | $27,480 |
| 2019 | $1,306 | $38,460 | $10,000 | $28,460 |
| 2018 | $1,219 | $32,920 | $8,000 | $24,920 |
| 2017 | $498 | $29,550 | $8,000 | $21,550 |
| 2016 | $1,117 | $29,900 | $8,000 | $21,900 |
| 2015 | -- | $29,600 | $7,000 | $22,600 |
| 2014 | -- | $25,210 | $8,000 | $17,210 |
Source: Public Records
Map
Nearby Homes
- 14699 SW Doctor Martin L King Junior Dr
- 14766 SW 169th Dr
- 14847 SW 170th Ave
- 14597 SW 170th Ave
- 14745 SW 174th Ct
- 16245 SW Indianwood Cir
- 16237 SW Indianwood Cir
- 16300 SW Indianwood Cir
- 16228 SW Indianwood Cir
- 16235 SW Indianwood Cir
- 16304 SW Indianwood Cir
- 14450 SW Sand Wedge Dr
- 16308 SW Indianwood Cir
- 16332 SW Indianwood Cir
- 14338 SW Rain Rd
- 14418 SW Golf Club Dr
- 14336 SW Rain Rd
- 16398 SW Two Wood Way
- 14337 SW Rain Rd
- 14359 SW Sand Wedge Dr
- 17081 SW Magnolia St Unit 17093
- 14861 SW 171st Ave
- 17121 SW Magnolia St
- 17071 SW Magnolia St
- 14712 SW Magnolia St
- 14648 SW Dr Martin l King jr Dr
- 17123 SW Magnolia St
- 17131 SW Magnolia St
- 14722 SW 171st Ave
- 14751 SW 171st Ave
- 14732 SW 171st Ave
- 17141 SW Magnolia St
- 14750 SW Dr Martin l King jr Dr
- 14808 SW Doctor Martin L King Junior Dr
- 14819 SW Doctor Martin L King Junior Dr
- 14849 SW Doctor Martin L King Junior Dr
- 14739 SW Doctor Martin L King Junior Dr
- 14810 SW Doctor Martin L King Junior Dr
- 14965 SW Doctor Martin L King Junior Dr
- 14679 SW Mlk jr Dr