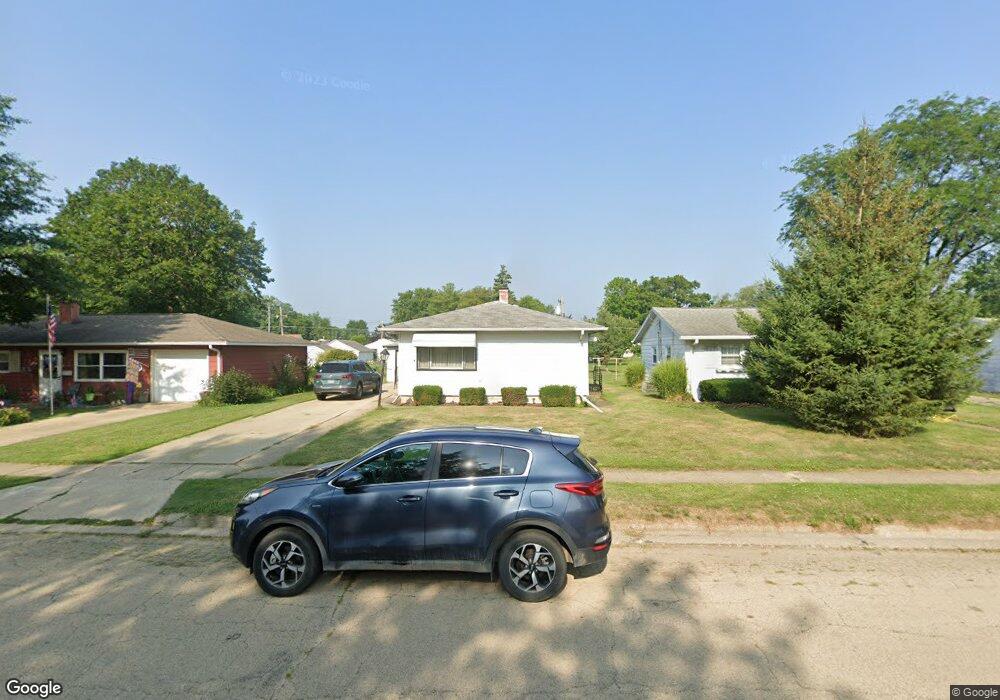
1711 19th Ave Sterling, IL 61081
Estimated Value: $107,281 - $154,000
Studio
--
Bath
894
Sq Ft
$157/Sq Ft
Est. Value
About This Home
This home is located at 1711 19th Ave, Sterling, IL 61081 and is currently estimated at $140,570, approximately $157 per square foot. 1711 19th Ave is a home located in Whiteside County with nearby schools including Christ Lutheran School.
Ownership History
Date
Name
Owned For
Owner Type
Purchase Details
Closed on
Jan 19, 2024
Sold by
Seeley Daena and Winchell David J
Bought by
Roman Stephanie M
Current Estimated Value
Home Financials for this Owner
Home Financials are based on the most recent Mortgage that was taken out on this home.
Original Mortgage
$61,110
Outstanding Balance
$59,600
Interest Rate
7.03%
Mortgage Type
New Conventional
Estimated Equity
$80,970
Purchase Details
Closed on
Dec 6, 2016
Sold by
Winchell Kathryn M
Bought by
Winchell David J and Fitzgerald Nancy M
Create a Home Valuation Report for This Property
The Home Valuation Report is an in-depth analysis detailing your home's value as well as a comparison with similar homes in the area
Home Values in the Area
Average Home Value in this Area
Purchase History
We collect this data history from publicly available records. To have your information removed, we recommend requesting removal directly through your county’s website.
| Date | Buyer | Sale Price | Title Company |
|---|---|---|---|
| Roman Stephanie M | $63,000 | None Listed On Document | |
| Winchell David J | -- | None Available |
Source: Public Records
Mortgage History
We collect this data history from publicly available records. To have your information removed, we recommend requesting removal directly through your county’s website.
| Date | Status | Borrower | Loan Amount |
|---|---|---|---|
| Open | Roman Stephanie M | $61,110 |
Source: Public Records
Tax History
| Year | Tax Paid | Tax Assessment Tax Assessment Total Assessment is a certain percentage of the fair market value that is determined by local assessors to be the total taxable value of land and additions on the property. | Land | Improvement |
|---|---|---|---|---|
| 2025 | $2,958 | $35,119 | $3,895 | $31,224 |
| 2024 | $3,447 | $33,060 | $3,667 | $29,393 |
| 2023 | $805 | $31,033 | $3,442 | $27,591 |
| 2022 | $821 | $29,691 | $3,293 | $26,398 |
| 2021 | $840 | $27,999 | $3,105 | $24,894 |
| 2020 | $846 | $27,018 | $2,996 | $24,022 |
| 2019 | $856 | $26,528 | $2,942 | $23,586 |
| 2018 | $846 | $26,571 | $2,947 | $23,624 |
| 2017 | $853 | $26,389 | $2,927 | $23,462 |
| 2016 | $859 | $25,539 | $2,833 | $22,706 |
| 2015 | $799 | $26,240 | $2,911 | $23,329 |
| 2014 | $82 | $25,657 | $2,846 | $22,811 |
| 2013 | $799 | $26,240 | $2,911 | $23,329 |
Source: Public Records
Map
Nearby Homes
Your Personal Tour Guide
Ask me questions while you tour the home.