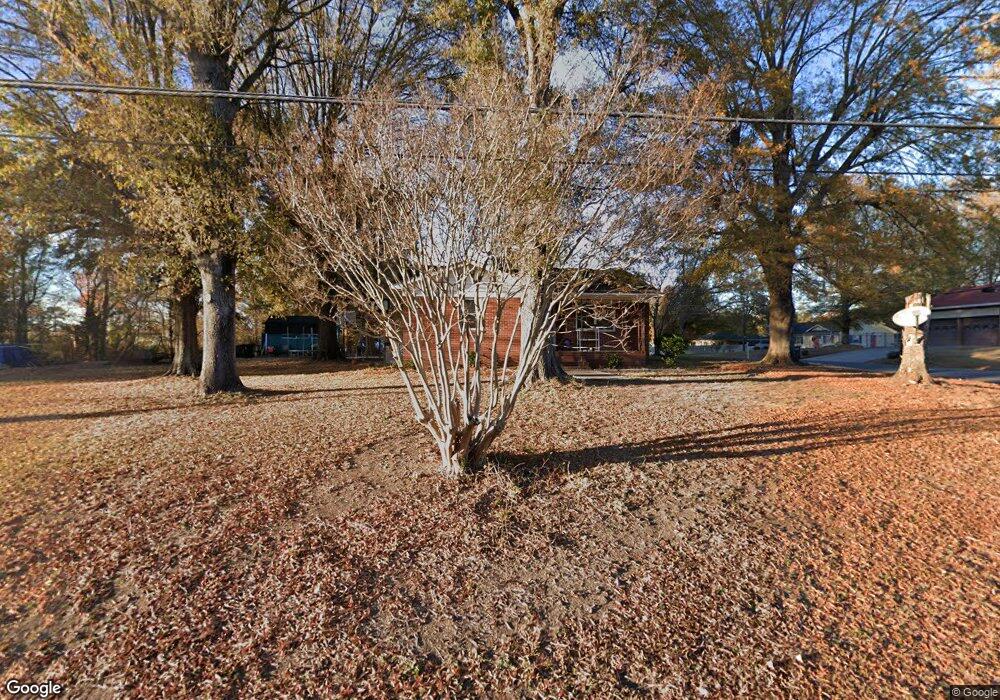
1711 Ashcraft Ave Monroe, NC 28110
Estimated Value: $314,598 - $327,000
3
Beds
1
Bath
1,880
Sq Ft
$170/Sq Ft
Est. Value
About This Home
This home is located at 1711 Ashcraft Ave, Monroe, NC 28110 and is currently estimated at $319,900, approximately $170 per square foot. 1711 Ashcraft Ave is a home located in Union County with nearby schools including Rock Rest Elementary School, Monroe Middle School, and Monroe High School.
Ownership History
Date
Name
Owned For
Owner Type
Purchase Details
Closed on
Sep 11, 2018
Sold by
Storey Horton Jr Boyd and Storey Horton Kelly
Bought by
Horton Boyd
Current Estimated Value
Purchase Details
Closed on
Jan 12, 2009
Sold by
Storey Eric C and Storey Kristina
Bought by
Horton Boyd and Horton Kelly
Purchase Details
Closed on
Jan 5, 2009
Sold by
The Bank Of New York Mellon Trust Compan
Bought by
Storey Eric C
Purchase Details
Closed on
Sep 12, 2008
Sold by
Anthony Alma L and Livingston Mary
Bought by
The Bank Of New York Mellon Trust Co Na and Jpmorgan Chase Bank Na
Purchase Details
Closed on
Oct 1, 1998
Sold by
Mary Livingston and Mary Alma L
Bought by
Anthony Alma L and Livingston Mary
Home Financials for this Owner
Home Financials are based on the most recent Mortgage that was taken out on this home.
Original Mortgage
$75,200
Interest Rate
6.96%
Create a Home Valuation Report for This Property
The Home Valuation Report is an in-depth analysis detailing your home's value as well as a comparison with similar homes in the area
Purchase History
| Date | Buyer | Sale Price | Title Company |
|---|---|---|---|
| Horton Boyd | -- | Chicago Title Insurance Comp | |
| Horton Boyd | -- | None Available | |
| Storey Eric C | $53,000 | None Available | |
| The Bank Of New York Mellon Trust Co Na | $104,669 | None Available | |
| Anthony Alma L | -- | -- |
Source: Public Records
Mortgage History
| Date | Status | Borrower | Loan Amount |
|---|---|---|---|
| Previous Owner | Anthony Alma L | $75,200 |
Source: Public Records
Tax History
| Year | Tax Paid | Tax Assessment Tax Assessment Total Assessment is a certain percentage of the fair market value that is determined by local assessors to be the total taxable value of land and additions on the property. | Land | Improvement |
|---|---|---|---|---|
| 2025 | $2,644 | $302,400 | $0 | $0 |
| 2024 | $2,243 | $205,700 | $17,900 | $187,800 |
| 2023 | $2,243 | $205,700 | $17,900 | $187,800 |
| 2022 | $2,243 | $205,700 | $17,900 | $187,800 |
| 2021 | $2,243 | $205,700 | $17,900 | $187,800 |
| 2020 | $938 | $69,600 | $14,500 | $55,100 |
| 2019 | $938 | $69,600 | $14,500 | $55,100 |
| 2018 | $429 | $69,600 | $14,500 | $55,100 |
| 2017 | $952 | $69,600 | $14,500 | $55,100 |
| 2016 | $942 | $69,600 | $14,500 | $55,100 |
| 2015 | $540 | $69,600 | $14,500 | $55,100 |
| 2014 | $1,254 | $102,810 | $19,540 | $83,270 |
Source: Public Records
Map
Nearby Homes
- 307 Jones St
- 706 Mcintyre St
- 0 N Square Dr
- 707 Creekridge Dr
- 606 Lasalle St
- 720 Mclarty St
- 406 N Thompson St
- 1202 E Franklin St
- 948 Scotch Meadows Loop
- 217 Winburn St
- 913 Winchester Ave
- 802 E Franklin St
- 500 Boyte St
- 417 Boyte St
- 1107 Burke St
- 1232 Scotch Meadows Loop
- 1111 Keswick Place Unit 13
- 509 Beard St
- 207 Maurice St
- 408 Willoughby Park Dr
- 1707 Ashcraft Ave
- 109 Mcintyre St
- 1801 Ashcraft Ave
- 113 Mcintyre St
- 102 Mcintyre St
- 1803 Ashcraft Ave
- 213 Mcintyre St
- 1805 Ashcraft Ave
- 200 Mcintyre St
- 1804 Union St
- 215 Mcintyre St
- 1807 Ashcraft Ave
- 202 Mcintyre St
- 1806 Union St
- 0 Ashcraft Ave Unit 2059953
- 1805 Union St
- 217 Mcintyre St
- 1809 Ashcraft Ave
- 204 Mcintyre St
- 1808 Union St
Your Personal Tour Guide
Ask me questions while you tour the home.