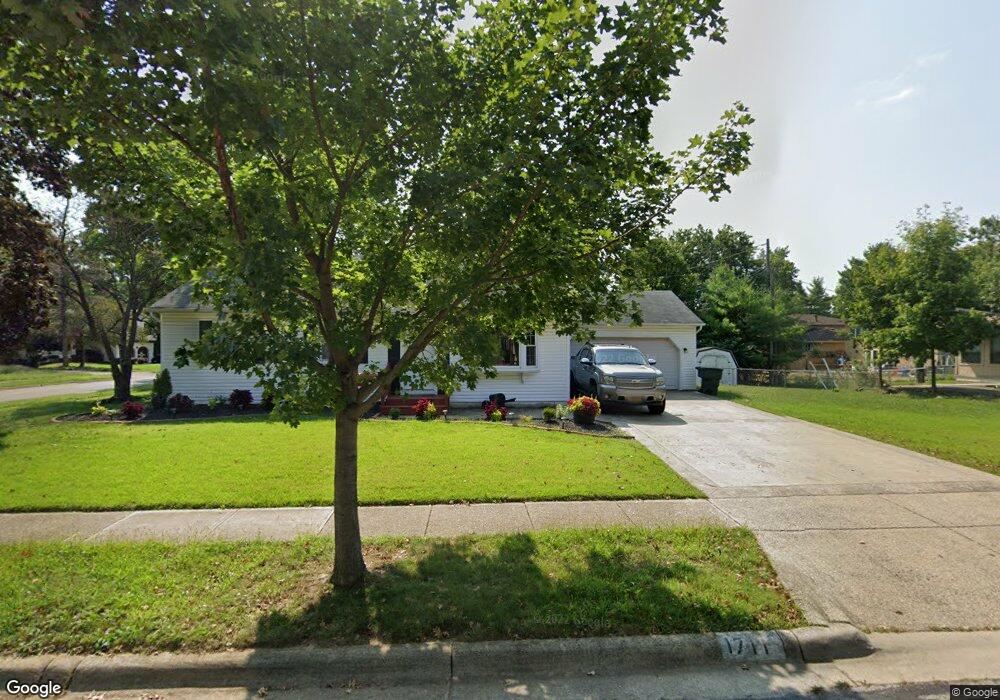
1711 Blue Ash Place Columbus, OH 43229
Forest Park East NeighborhoodEstimated Value: $298,000 - $313,000
3
Beds
2
Baths
1,656
Sq Ft
$184/Sq Ft
Est. Value
About This Home
This home is located at 1711 Blue Ash Place, Columbus, OH 43229 and is currently estimated at $305,089, approximately $184 per square foot. 1711 Blue Ash Place is a home located in Franklin County with nearby schools including Parkmoor Elementary School, Woodward Park Middle School, and Northland High School.
Ownership History
Date
Name
Owned For
Owner Type
Purchase Details
Closed on
Mar 11, 2020
Sold by
Mk Capital Llc
Bought by
Hoke Brandon L
Current Estimated Value
Home Financials for this Owner
Home Financials are based on the most recent Mortgage that was taken out on this home.
Original Mortgage
$197,000
Outstanding Balance
$174,472
Interest Rate
3.5%
Mortgage Type
VA
Estimated Equity
$130,617
Purchase Details
Closed on
Aug 29, 2019
Sold by
Garrison Richard L and Citimortgage Inc
Bought by
Mk Capital Llc
Purchase Details
Closed on
Jun 28, 2007
Sold by
Schoendorff Phillip A
Bought by
Garrison Richard L and Garrison Casie M
Home Financials for this Owner
Home Financials are based on the most recent Mortgage that was taken out on this home.
Original Mortgage
$134,842
Interest Rate
6.42%
Mortgage Type
FHA
Purchase Details
Closed on
Dec 23, 1993
Purchase Details
Closed on
Mar 4, 1991
Create a Home Valuation Report for This Property
The Home Valuation Report is an in-depth analysis detailing your home's value as well as a comparison with similar homes in the area
Home Values in the Area
Average Home Value in this Area
Purchase History
| Date | Buyer | Sale Price | Title Company |
|---|---|---|---|
| Hoke Brandon L | $197,000 | Williamson Title Agency | |
| Mk Capital Llc | $121,606 | None Available | |
| Garrison Richard L | $137,000 | Valmer Land | |
| -- | $77,000 | -- | |
| -- | $77,000 | -- |
Source: Public Records
Mortgage History
| Date | Status | Borrower | Loan Amount |
|---|---|---|---|
| Open | Hoke Brandon L | $197,000 | |
| Previous Owner | Garrison Richard L | $134,842 |
Source: Public Records
Tax History Compared to Growth
Tax History
| Year | Tax Paid | Tax Assessment Tax Assessment Total Assessment is a certain percentage of the fair market value that is determined by local assessors to be the total taxable value of land and additions on the property. | Land | Improvement |
|---|---|---|---|---|
| 2024 | $3,691 | $92,050 | $21,140 | $70,910 |
| 2023 | $4,078 | $92,050 | $21,140 | $70,910 |
| 2022 | $3,398 | $65,520 | $16,380 | $49,140 |
| 2021 | $3,404 | $65,520 | $16,380 | $49,140 |
| 2020 | $3,077 | $57,720 | $16,380 | $41,340 |
| 2019 | $2,559 | $42,180 | $12,150 | $30,030 |
| 2018 | $2,553 | $42,180 | $12,150 | $30,030 |
| 2017 | $2,454 | $42,180 | $12,150 | $30,030 |
| 2016 | $2,352 | $35,500 | $9,700 | $25,800 |
| 2015 | $2,135 | $35,500 | $9,700 | $25,800 |
| 2014 | $2,140 | $35,500 | $9,700 | $25,800 |
| 2013 | $1,111 | $37,380 | $10,220 | $27,160 |
Source: Public Records
Map
Nearby Homes
- 1722 Blue Ash Place
- 5485 Tamarack Blvd
- 1687 Brookfield Square S
- 1914 Walden Dr
- 1752 Pine Tree St S Unit H
- 5727 Tamarack Blvd Unit A
- 1743 Pine Tree St N Unit A
- 1881 Brimfield Rd
- 1492 Cottonwood Dr
- 5231 Arrowood Ct
- 5726 Beechcroft Rd Unit J
- 5732 Beechcroft Rd Unit B
- 2084 Brookfield Rd
- 5124 Northcliff Loop W
- 1493 Boxwood Dr
- 1704 Riverbirch Dr
- 5204 Honeytree Loop W
- 1390 E Dublin Granville Rd
- 2058 Northcliff Dr
- 6035 Karl Rd
- 1703 Blue Ash Place
- 5499 Pine Bluff Rd
- 5512 Blue Ash Rd
- 1712 Blue Ash Place
- 1704 Blue Ash Place
- 1739 Blue Ash Place
- 5504 Blue Ash Rd
- 5500 Pine Bluff Rd
- 1728 Blue Ash Place
- 5489 Pine Bluff Rd
- 1696 Blue Ash Place
- 5496 Pine Bluff Rd
- 5496 Blue Ash Rd
- 1738 Blue Ash Place
- 5481 Pine Bluff Rd
- 5486 Pine Bluff Rd
- 1688 Blue Ash Place
- 1709 Rocky Pine Loop S
- 1721 Rocky Pine Loop S