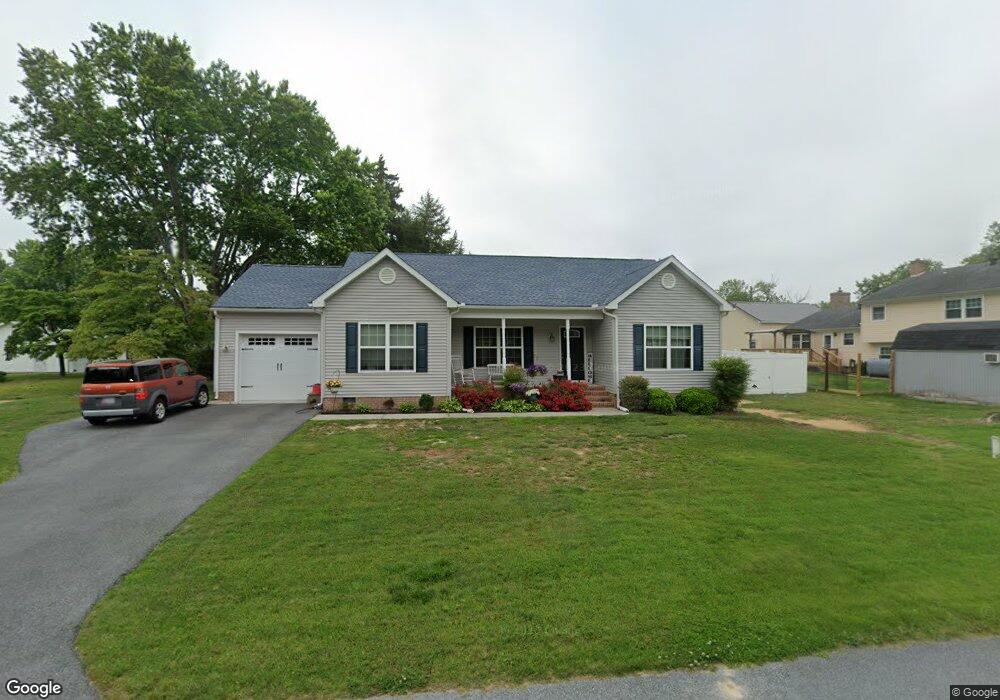
1711 Crestwood Cir Salisbury, MD 21804
South Salisbury NeighborhoodEstimated Value: $286,454 - $358,000
--
Bed
--
Bath
1,308
Sq Ft
$235/Sq Ft
Est. Value
About This Home
This home is located at 1711 Crestwood Cir, Salisbury, MD 21804 and is currently estimated at $307,614, approximately $235 per square foot. 1711 Crestwood Cir is a home located in Wicomico County with nearby schools including Charles H. Chipman Elementary School, Glen Avenue Elementary School, and Wicomico Middle School.
Ownership History
Date
Name
Owned For
Owner Type
Purchase Details
Closed on
Jun 19, 2017
Sold by
Price Douglas A and Perdue David F
Bought by
Skoglund Elizabeth Ann and Skoglund Thomas David
Current Estimated Value
Home Financials for this Owner
Home Financials are based on the most recent Mortgage that was taken out on this home.
Original Mortgage
$185,576
Outstanding Balance
$154,487
Interest Rate
4.05%
Mortgage Type
FHA
Estimated Equity
$153,127
Purchase Details
Closed on
Oct 11, 2016
Sold by
Owens Ellen C
Bought by
Price Douglas A and Perdue David F
Purchase Details
Closed on
Oct 3, 2012
Sold by
Bounds Donald B
Bought by
Owens Ellen C
Purchase Details
Closed on
Mar 30, 2006
Sold by
Bounds Eldred L and Bounds Ruth B
Bought by
Bounds Donald B and Owens Ellen C
Purchase Details
Closed on
Mar 17, 2006
Sold by
Bounds Eldred L and Bounds Ruth B
Bought by
Bounds Donald B and Owens Ellen C
Create a Home Valuation Report for This Property
The Home Valuation Report is an in-depth analysis detailing your home's value as well as a comparison with similar homes in the area
Home Values in the Area
Average Home Value in this Area
Purchase History
| Date | Buyer | Sale Price | Title Company |
|---|---|---|---|
| Skoglund Elizabeth Ann | $189,000 | Mid Atlantic Title & Escrow | |
| Price Douglas A | $23,000 | Delmarva Title | |
| Owens Ellen C | -- | None Available | |
| Bounds Donald B | -- | -- | |
| Bounds Donald B | -- | -- |
Source: Public Records
Mortgage History
| Date | Status | Borrower | Loan Amount |
|---|---|---|---|
| Open | Skoglund Elizabeth Ann | $185,576 |
Source: Public Records
Tax History Compared to Growth
Tax History
| Year | Tax Paid | Tax Assessment Tax Assessment Total Assessment is a certain percentage of the fair market value that is determined by local assessors to be the total taxable value of land and additions on the property. | Land | Improvement |
|---|---|---|---|---|
| 2025 | $1,869 | $221,400 | $32,900 | $188,500 |
| 2024 | $1,869 | $206,100 | $0 | $0 |
| 2023 | $1,829 | $190,800 | $0 | $0 |
| 2022 | $1,788 | $175,500 | $32,900 | $142,600 |
| 2021 | $1,780 | $174,100 | $0 | $0 |
| 2020 | $128 | $172,700 | $0 | $0 |
| 2019 | $1,793 | $171,300 | $32,900 | $138,400 |
| 2018 | $1,736 | $165,300 | $0 | $0 |
| 2017 | $244 | $159,300 | $0 | $0 |
| 2016 | -- | $22,900 | $0 | $0 |
| 2015 | $287 | $22,900 | $0 | $0 |
| 2014 | $287 | $22,900 | $0 | $0 |
Source: Public Records
Map
Nearby Homes
- 350 Tilghman Rd
- 1801 Woodbrooke Dr
- 1801 Crawford Dr
- 316 Autumn Terrace
- 427 Valleywood Dr
- 303 Viewfield Dr
- 305 Viewfield Dr
- 2005 Whispering Ponds Ct Unit 2A
- 1027 Zircon Ct
- 934 James Ct
- 2000 Whispering Ponds Ct Unit 1 B
- 506 Edgewater Dr
- 1000 Limestone Ct
- 1601 Glen Ave
- 1017 Sandstone Ct
- Lot 6 Sweetbay Dr
- 1000 Sandstone Ct
- 602 Terrapin Ln
- Lots 3A/4 Sweet Bay Dr
- 2712 Merritt Mill Rd
- Lot 9-D Crestwood Cir
- 1705 Crestwood Cir
- 404 Nomreh Rd
- 402 Nomreh Rd
- 1703 Crestwood Cir
- 1712 Crestwood Cir
- 400 Nomreh Rd
- 1710 Crestwood Cir
- Lot 9 Crestwood Cir
- 1714 Crestwood Cir
- 1701 Crestwood Cir
- 1708 Crestwood Cir
- 405 Nomreh Rd
- 403 Nomreh Rd
- 1704 Crestwood Cir
- 1702 Crestwood Cir
- 1702 Mount Hermon Rd
- 1700 Mount Hermon Rd
- 1716 Crestwood Cir
- 1704 Mount Hermon Rd