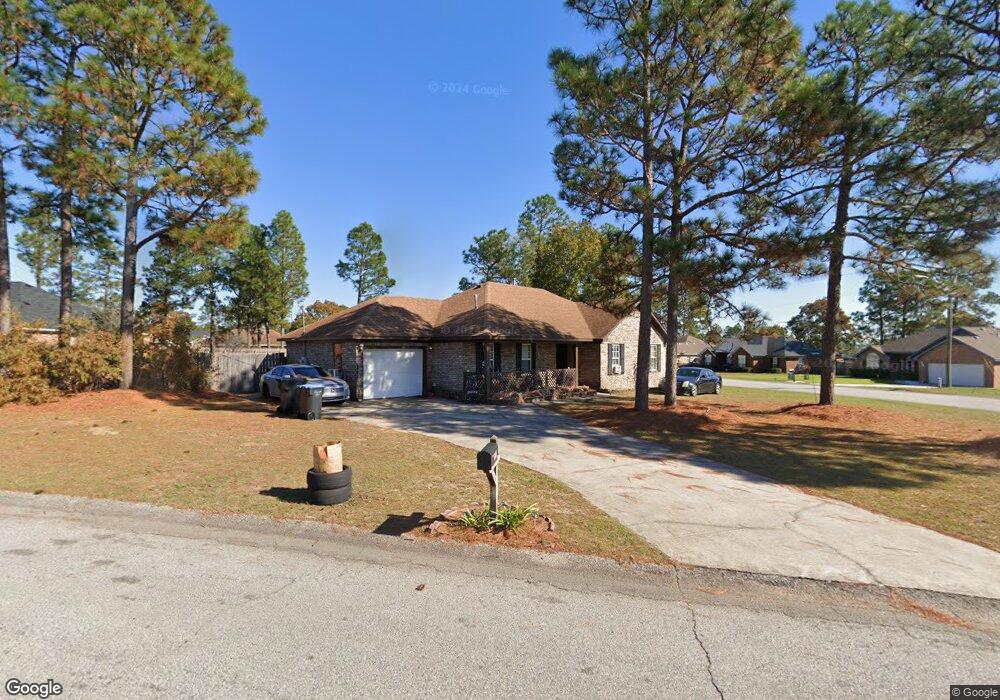
1711 Deer Chase Ln Hephzibah, GA 30815
Jamestown NeighborhoodEstimated Value: $233,553 - $249,000
3
Beds
2
Baths
1,554
Sq Ft
$156/Sq Ft
Est. Value
About This Home
This home is located at 1711 Deer Chase Ln, Hephzibah, GA 30815 and is currently estimated at $241,888, approximately $155 per square foot. 1711 Deer Chase Ln is a home located in Richmond County with nearby schools including Deer Chase Elementary School, Hephzibah Middle School, and Johnson Magnet.
Ownership History
Date
Name
Owned For
Owner Type
Purchase Details
Closed on
Mar 13, 2009
Sold by
Nickson Warren and Nickson Donna S
Bought by
Mack Chandra E
Current Estimated Value
Home Financials for this Owner
Home Financials are based on the most recent Mortgage that was taken out on this home.
Original Mortgage
$142,907
Outstanding Balance
$91,249
Interest Rate
5.29%
Mortgage Type
VA
Estimated Equity
$150,639
Purchase Details
Closed on
Sep 30, 2002
Sold by
Front Line Homes Inc
Bought by
Nickson Warren and Nickson Donna S
Home Financials for this Owner
Home Financials are based on the most recent Mortgage that was taken out on this home.
Original Mortgage
$119,850
Interest Rate
6.27%
Mortgage Type
VA
Create a Home Valuation Report for This Property
The Home Valuation Report is an in-depth analysis detailing your home's value as well as a comparison with similar homes in the area
Home Values in the Area
Average Home Value in this Area
Purchase History
| Date | Buyer | Sale Price | Title Company |
|---|---|---|---|
| Mack Chandra E | $139,900 | None Available | |
| Nickson Warren | $117,500 | -- |
Source: Public Records
Mortgage History
| Date | Status | Borrower | Loan Amount |
|---|---|---|---|
| Open | Mack Chandra E | $142,907 | |
| Previous Owner | Nickson Warren | $119,850 |
Source: Public Records
Tax History Compared to Growth
Tax History
| Year | Tax Paid | Tax Assessment Tax Assessment Total Assessment is a certain percentage of the fair market value that is determined by local assessors to be the total taxable value of land and additions on the property. | Land | Improvement |
|---|---|---|---|---|
| 2025 | $470 | $93,560 | $12,400 | $81,160 |
| 2024 | $470 | $89,212 | $12,400 | $76,812 |
| 2023 | $406 | $81,396 | $12,400 | $68,996 |
| 2022 | $396 | $70,056 | $12,400 | $57,656 |
| 2021 | $396 | $52,880 | $12,400 | $40,480 |
| 2020 | $396 | $52,880 | $12,400 | $40,480 |
| 2019 | $396 | $52,880 | $12,400 | $40,480 |
| 2018 | $396 | $52,880 | $12,400 | $40,480 |
| 2017 | $2,113 | $52,880 | $12,400 | $40,480 |
| 2016 | $2,115 | $52,880 | $12,400 | $40,480 |
| 2015 | $2,129 | $52,880 | $12,400 | $40,480 |
| 2014 | $2,131 | $52,880 | $12,400 | $40,480 |
Source: Public Records
Map
Nearby Homes
- 2213 Riley Ct
- 1855 Beaver Creek Ln
- 1914 Mitchell Place
- 1764 Deer Chase Ln
- 2682 Inverness Dr
- 2686 Inverness Dr
- 2690 Inverness Dr
- 2705 Inverness Dr
- 2525 Hollington Dr
- 2698 Inverness Dr
- 2709 Inverness Dr
- 2524 Hollington Dr
- 2613 Inverness Dr
- 2713 Inverness Dr
- 2520 Hollington Dr
- 2706 Inverness Dr
- 2710 Inverness Dr
- 2721 Inverness Dr
- 2640 Carrington Dr
- 2512 Hollington Dr
- 1713 Deer Chase Ln
- 1813 Claystone Way
- 1709 Deer Chase Ln
- 1826 Claystone Way
- 1824 Claystone Way
- 1724 Deer Chase Ln
- 1722 Deer Chase Ln
- 1715 Deer Chase Ln
- 1904 Carvers Ct
- 1822 Claystone Way
- 1902 Carvers Ct
- 1726 Deer Chase Ln
- 1720 Deer Chase Ln
- 1906 Carvers Ct
- 1707 Deer Chase Ln
- 1820 Claystone Way
- 1728 Deer Chase Ln
- 1717 Deer Chase Ln
- 1717 Deer Chase Ln
- 1718 Deer Chase Ln