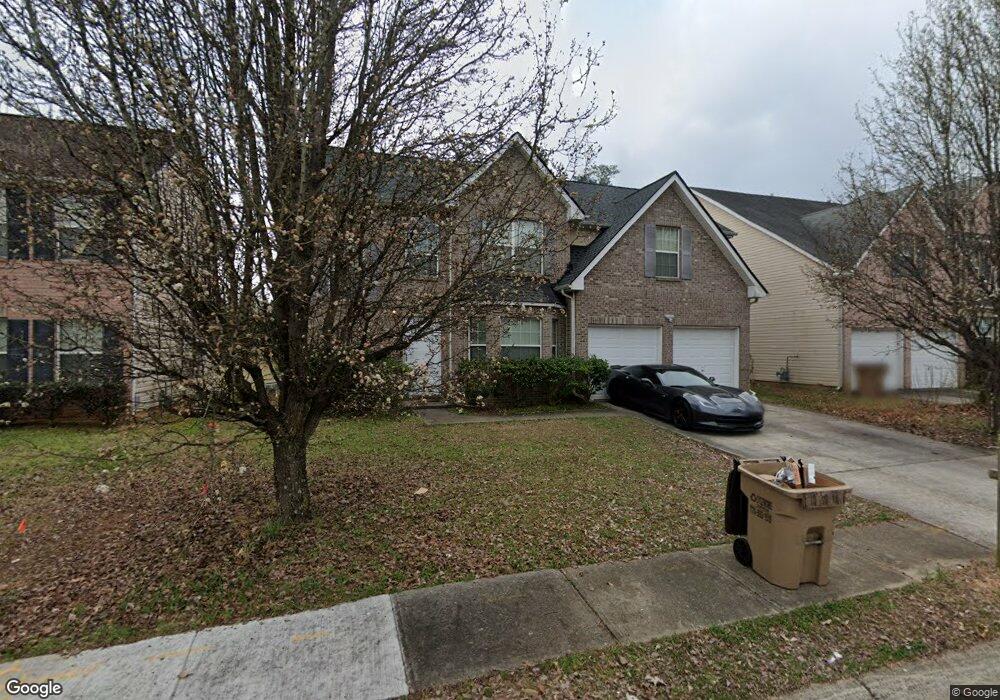
1711 Deer Crossing Cir Unit 74 Jonesboro, GA 30236
Estimated Value: $259,098 - $304,000
4
Beds
3
Baths
1,786
Sq Ft
$158/Sq Ft
Est. Value
About This Home
This home is located at 1711 Deer Crossing Cir Unit 74, Jonesboro, GA 30236 and is currently estimated at $282,275, approximately $158 per square foot. 1711 Deer Crossing Cir Unit 74 is a home located in Clayton County with nearby schools including Suder Elementary School, Mundys Mill Middle School, and Jonesboro High School.
Ownership History
Date
Name
Owned For
Owner Type
Purchase Details
Closed on
Feb 9, 2024
Sold by
Mallory Laquanta Shanetta
Bought by
Griffin Laquanta Mallory
Current Estimated Value
Home Financials for this Owner
Home Financials are based on the most recent Mortgage that was taken out on this home.
Original Mortgage
$172,975
Outstanding Balance
$169,947
Interest Rate
6.66%
Mortgage Type
VA
Estimated Equity
$112,328
Purchase Details
Closed on
May 18, 2018
Sold by
Michael Diah
Bought by
Mallory Laquanta Shanetta
Home Financials for this Owner
Home Financials are based on the most recent Mortgage that was taken out on this home.
Original Mortgage
$133,536
Interest Rate
4.62%
Mortgage Type
FHA
Purchase Details
Closed on
Dec 8, 2004
Sold by
Legacy Cmntys Of Manor Llc
Bought by
Diah Michael and Diah Lukesha
Home Financials for this Owner
Home Financials are based on the most recent Mortgage that was taken out on this home.
Original Mortgage
$151,850
Interest Rate
5.61%
Mortgage Type
VA
Create a Home Valuation Report for This Property
The Home Valuation Report is an in-depth analysis detailing your home's value as well as a comparison with similar homes in the area
Home Values in the Area
Average Home Value in this Area
Purchase History
| Date | Buyer | Sale Price | Title Company |
|---|---|---|---|
| Griffin Laquanta Mallory | -- | -- | |
| Mallory Laquanta Shanetta | $136,000 | -- | |
| Diah Michael | $153,200 | -- |
Source: Public Records
Mortgage History
| Date | Status | Borrower | Loan Amount |
|---|---|---|---|
| Open | Griffin Laquanta Mallory | $172,975 | |
| Closed | Griffin Laquanta Mallory | $172,975 | |
| Previous Owner | Mallory Laquanta Shanetta | $133,536 | |
| Previous Owner | Mallory Laquanta Shanetta | $4,760 | |
| Previous Owner | Diah Michael | $151,850 |
Source: Public Records
Tax History Compared to Growth
Tax History
| Year | Tax Paid | Tax Assessment Tax Assessment Total Assessment is a certain percentage of the fair market value that is determined by local assessors to be the total taxable value of land and additions on the property. | Land | Improvement |
|---|---|---|---|---|
| 2024 | $3,445 | $97,320 | $9,600 | $87,720 |
| 2023 | $3,508 | $97,160 | $9,600 | $87,560 |
| 2022 | $2,638 | $76,240 | $9,600 | $66,640 |
| 2021 | $2,040 | $60,680 | $9,600 | $51,080 |
| 2020 | $1,929 | $57,278 | $9,600 | $47,678 |
| 2019 | $1,765 | $52,547 | $9,600 | $42,947 |
| 2018 | $2,002 | $48,368 | $9,600 | $38,768 |
| 2017 | $1,860 | $44,775 | $9,600 | $35,175 |
| 2016 | $1,780 | $42,821 | $9,600 | $33,221 |
| 2015 | $1,488 | $0 | $0 | $0 |
| 2014 | $862 | $30,707 | $9,600 | $21,107 |
Source: Public Records
Map
Nearby Homes
- 1770 Deer Crossing Cir
- 9492 Deer Crossing Trace
- 1814 Deer Crossing Way
- 0 Turner Rd Unit 20172270
- 0 Turner Rd Unit 20172265
- 9419 Rocky Creek
- 9510 Creekside Rd
- 1935 Watercrest Dr
- 1720 Byrom Pkwy Unit 2
- 9243 Seminole Rd
- 9176 Chickasaw Ct
- 9444 Maple Grove Ln Unit 60
- 9124 Ogala Ct
- 9457 Maple Grove Ln Unit LOT 262
- 9451 Maple Grove Ln Unit LOT 265
- 9132 Endicott Place
- 9441 Maple Grove Ln Unit LOT 267
- 1879 Lake Chase Ln
- 9394 Maple Grove Ln Unit 37
- 9394 Maple Grove Ln
- 1711 Deer Crossing Cir
- 1717 Deer Crossing Cir
- 1705 Deer Crossing Cir
- 1723 Deer Crossing Cir
- 1710 Deer Crossing Cir
- 1699 Deer Crossing Cir
- 1704 Deer Crossing Cir
- 1729 Deer Crossing Cir
- 1693 Deer Crossing Cir Unit 2
- 1698 Deer Crossing Cir
- 1728 Deer Crossing Cir
- 1692 Deer Crossing Cir
- 9432 Deer Crossing Trace
- 1686 Deer Crossing Cir
- 1734 Deer Crossing Cir Unit 15
- 1734 Deer Crossing Cir
- 1680 Deer Crossing Cir
- 1741 Deer Crossing Cir
- 9438 Deer Crossing Trace
- 1715 Deer Crossing Way