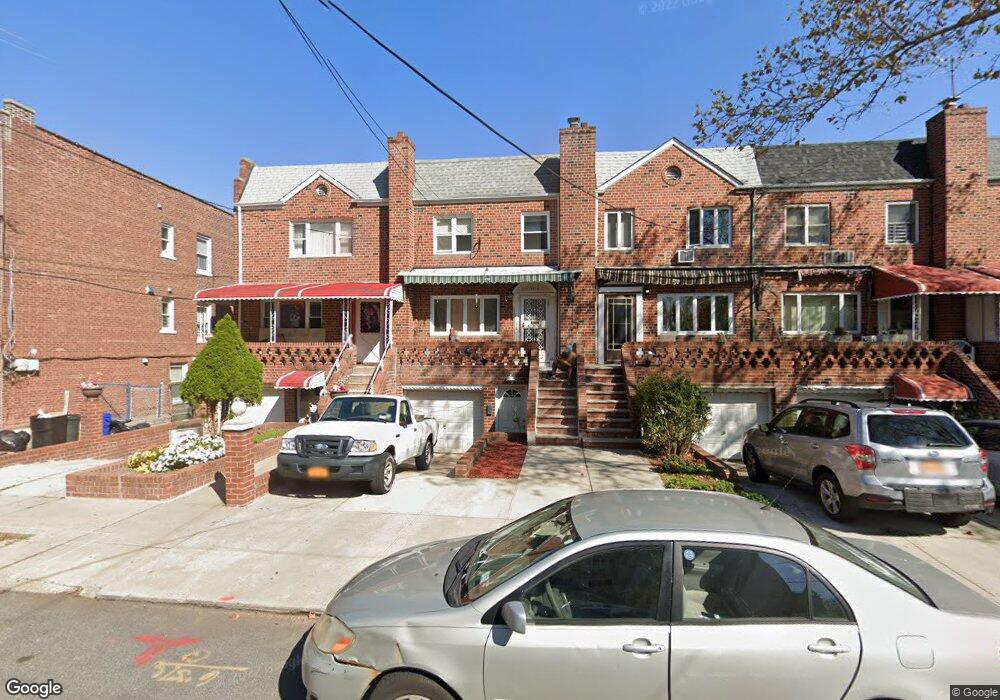
1711 E 34th St Brooklyn, NY 11234
Marine Park NeighborhoodEstimated Value: $863,280 - $991,000
Studio
--
Bath
1,827
Sq Ft
$513/Sq Ft
Est. Value
About This Home
This home is located at 1711 E 34th St, Brooklyn, NY 11234 and is currently estimated at $936,820, approximately $512 per square foot. 1711 E 34th St is a home located in Kings County with nearby schools including PS 222 Katherine R Snyder, J.H.S. 278 Marine Park, and James Madison High School.
Ownership History
Date
Name
Owned For
Owner Type
Purchase Details
Closed on
Apr 7, 2009
Sold by
Figueroa Carlos M
Bought by
Figueroa Carlos M and Roman Yanick
Current Estimated Value
Purchase Details
Closed on
May 24, 2006
Sold by
Figueroa Miguel
Bought by
Figueroa Carlos M
Purchase Details
Closed on
Jul 30, 1998
Sold by
Figueroa Miguel
Bought by
Figueroa Miguel
Create a Home Valuation Report for This Property
The Home Valuation Report is an in-depth analysis detailing your home's value as well as a comparison with similar homes in the area
Home Values in the Area
Average Home Value in this Area
Purchase History
| Date | Buyer | Sale Price | Title Company |
|---|---|---|---|
| Figueroa Carlos M | -- | -- | |
| Figueroa Carlos M | -- | -- | |
| Figueroa Carlos M | -- | -- | |
| Figueroa Carlos M | -- | -- | |
| Figueroa Miguel | -- | American Title Ins Co | |
| Figueroa Miguel | -- | American Title Ins Co |
Source: Public Records
Tax History
| Year | Tax Paid | Tax Assessment Tax Assessment Total Assessment is a certain percentage of the fair market value that is determined by local assessors to be the total taxable value of land and additions on the property. | Land | Improvement |
|---|---|---|---|---|
| 2025 | $7,368 | $47,220 | $10,560 | $36,660 |
| 2024 | $7,368 | $44,580 | $10,560 | $34,020 |
| 2023 | $7,284 | $49,860 | $10,560 | $39,300 |
| 2022 | $6,755 | $44,820 | $10,560 | $34,260 |
| 2021 | $7,122 | $40,500 | $10,560 | $29,940 |
| 2020 | $3,390 | $36,600 | $10,560 | $26,040 |
| 2019 | $6,395 | $36,600 | $10,560 | $26,040 |
| 2018 | $6,093 | $29,890 | $7,409 | $22,481 |
| 2017 | $5,749 | $28,200 | $8,927 | $19,273 |
| 2016 | $5,637 | $28,200 | $9,347 | $18,853 |
| 2015 | $3,209 | $27,003 | $9,539 | $17,464 |
| 2014 | $3,209 | $25,476 | $10,638 | $14,838 |
Source: Public Records
Map
Nearby Homes
- 1664 E 35th St
- 1638 E 36th St
- 1715 E 35th St
- 3617 Quentin Rd
- 1719 E 36th St
- 1663 E 32nd St
- 3620 Quentin Rd
- 1627 E 32nd St
- 1743 E 33rd St
- 1649 E 37th St
- 1736 E 33rd St
- 1632 E 38th St
- 1750 E 37th St
- 3112 Quentin Rd
- 3710 Avenue P
- 3806 Quentin Rd
- 1752 E 38th St
- 1551 E 32nd St
- 1774 E 32nd St
- 1569 E 34th St
Your Personal Tour Guide
Ask me questions while you tour the home.