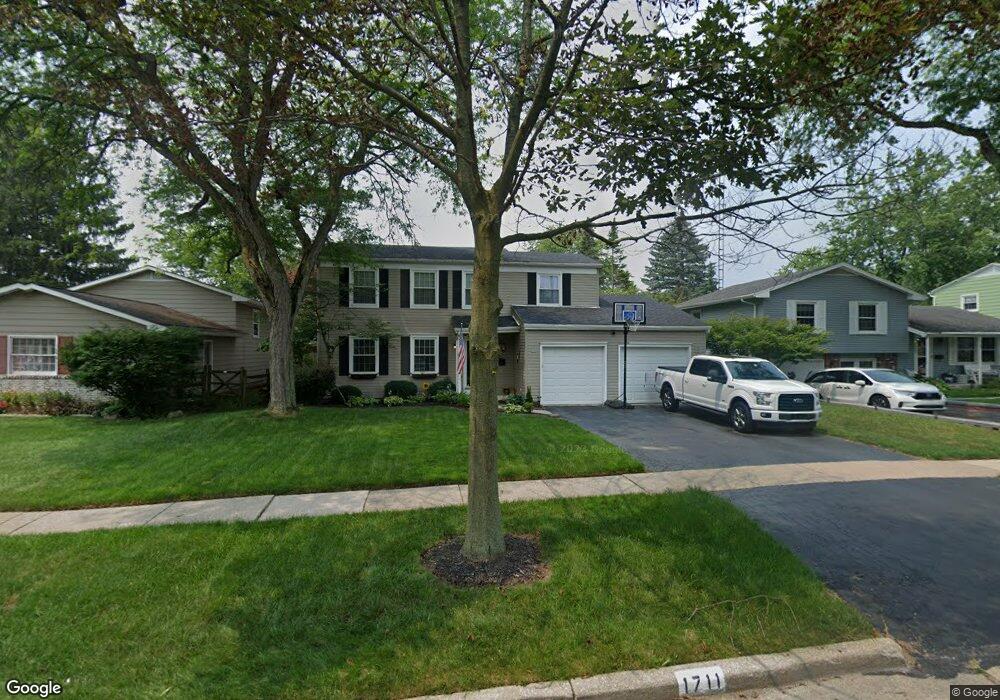
1711 Eastfield Dr Maumee, OH 43537
Estimated Value: $261,000 - $286,000
4
Beds
3
Baths
1,764
Sq Ft
$153/Sq Ft
Est. Value
About This Home
This home is located at 1711 Eastfield Dr, Maumee, OH 43537 and is currently estimated at $270,193, approximately $153 per square foot. 1711 Eastfield Dr is a home located in Lucas County with nearby schools including Fairfield Elementary School, Maumee Intermediate School, and Maumee Middle School.
Ownership History
Date
Name
Owned For
Owner Type
Purchase Details
Closed on
Dec 13, 2007
Sold by
Yeager John P and Yeager Christina M
Bought by
Sherman Christopher A and Navarez Maria I
Current Estimated Value
Home Financials for this Owner
Home Financials are based on the most recent Mortgage that was taken out on this home.
Original Mortgage
$149,625
Outstanding Balance
$94,755
Interest Rate
6.31%
Mortgage Type
Purchase Money Mortgage
Estimated Equity
$175,438
Purchase Details
Closed on
Jun 8, 2001
Sold by
Cassandra Jardine
Bought by
Yeager John P and Yeager Christina M
Home Financials for this Owner
Home Financials are based on the most recent Mortgage that was taken out on this home.
Original Mortgage
$114,900
Interest Rate
7.16%
Purchase Details
Closed on
Dec 17, 1998
Sold by
Jardine John J Revocable Trust and Jardine John G
Bought by
Jardine Cassandra
Purchase Details
Closed on
Feb 15, 1998
Sold by
Jardine John J and Jardine John J
Bought by
Jardine John J and John J Jardine Revocable Trust
Create a Home Valuation Report for This Property
The Home Valuation Report is an in-depth analysis detailing your home's value as well as a comparison with similar homes in the area
Home Values in the Area
Average Home Value in this Area
Purchase History
| Date | Buyer | Sale Price | Title Company |
|---|---|---|---|
| Sherman Christopher A | $157,500 | Chicago Title Insurance Co | |
| Yeager John P | $127,700 | -- | |
| Jardine Cassandra | $117,500 | -- | |
| Jardine John J | -- | -- |
Source: Public Records
Mortgage History
| Date | Status | Borrower | Loan Amount |
|---|---|---|---|
| Open | Sherman Christopher A | $149,625 | |
| Closed | Yeager John P | $114,900 |
Source: Public Records
Tax History Compared to Growth
Tax History
| Year | Tax Paid | Tax Assessment Tax Assessment Total Assessment is a certain percentage of the fair market value that is determined by local assessors to be the total taxable value of land and additions on the property. | Land | Improvement |
|---|---|---|---|---|
| 2024 | $2,616 | $81,305 | $9,135 | $72,170 |
| 2023 | $4,628 | $61,320 | $7,175 | $54,145 |
| 2022 | $4,117 | $61,320 | $7,175 | $54,145 |
| 2021 | $4,348 | $61,320 | $7,175 | $54,145 |
| 2020 | $4,190 | $52,605 | $5,880 | $46,725 |
| 2019 | $4,085 | $52,605 | $5,880 | $46,725 |
| 2018 | $3,866 | $52,605 | $5,880 | $46,725 |
| 2017 | $3,721 | $47,495 | $7,455 | $40,040 |
| 2016 | $3,679 | $135,700 | $21,300 | $114,400 |
| 2015 | $3,661 | $135,700 | $21,300 | $114,400 |
| 2014 | $3,414 | $46,590 | $7,320 | $39,270 |
| 2013 | $3,414 | $46,590 | $7,320 | $39,270 |
Source: Public Records
Map
Nearby Homes
- 538 Cambridge Park S
- 541 Fairfield Park Dr
- 652 Mcintyre Ln
- 4501 Thackeray Rd
- 611 Greenfield Dr
- 1409 Bradshaw Ct
- 1441 Bradshaw Ct
- 422 Chesterfield Ln
- 54 Homestead Place Unit 54
- 1466 Wilderness Dr
- 1539 Cass Rd
- 4237 Brogan Dr
- 1736 Parkway Dr N
- 1381 Junior Dr
- 1172 Shelly Ave
- 2451 Eastgate Rd
- 1301 Cass Rd
- 4534 Heathercove Place
- 4522 Heathercove Place
- 1138 Holgate Ave
- 1715 Eastfield Dr
- 1707 Eastfield Dr
- 1719 Eastfield Dr
- 1703 Eastfield Dr
- 552 Dussel Dr
- 1780 Cambridge Park E
- 1710 Eastfield Dr
- 1617 Eastfield Dr
- 1716 Eastfield Dr
- 613 Brahier Ln
- 548 Dussel Dr
- 1613 Eastfield Dr
- 549 Cambridge Park N
- 612 Brahier Ln
- 617 Brahier Ln
- 1772 Cambridge Park E
- 616 Dussel Dr
- 601 Dussel Dr
- 544 Dussel Dr
- 605 Dussel Dr