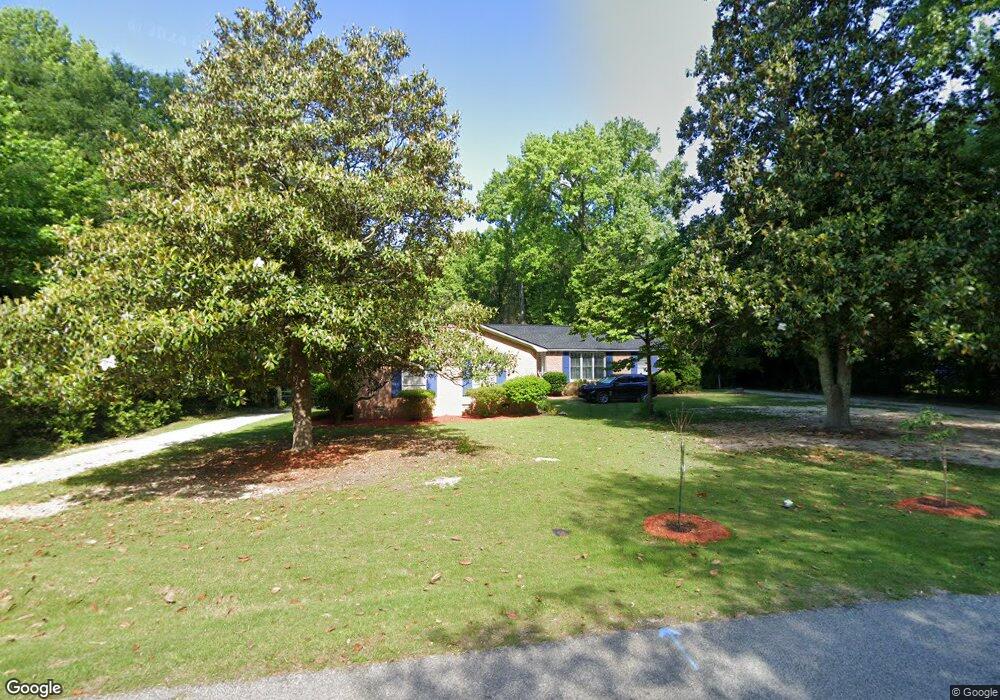
1711 Forest Dr Camden, SC 29020
Estimated Value: $276,000 - $337,190
3
Beds
2
Baths
2,011
Sq Ft
$158/Sq Ft
Est. Value
About This Home
This home is located at 1711 Forest Dr, Camden, SC 29020 and is currently estimated at $318,048, approximately $158 per square foot. 1711 Forest Dr is a home located in Kershaw County with nearby schools including Camden Elementary of the Creative Arts, Pine Tree Hill Elementary School, and Camden Middle School.
Ownership History
Date
Name
Owned For
Owner Type
Purchase Details
Closed on
Jul 25, 2022
Sold by
Ly Chmiel Tuyet Lisa
Bought by
Rocha Jose A and Rocha Ella M
Current Estimated Value
Home Financials for this Owner
Home Financials are based on the most recent Mortgage that was taken out on this home.
Original Mortgage
$264,180
Outstanding Balance
$251,640
Interest Rate
5.23%
Mortgage Type
VA
Estimated Equity
$66,409
Purchase Details
Closed on
Dec 15, 2021
Sold by
Chmiel Katherine S
Bought by
Chmiel Tuyet Lisa Ly
Home Financials for this Owner
Home Financials are based on the most recent Mortgage that was taken out on this home.
Original Mortgage
$100,000
Interest Rate
2.35%
Mortgage Type
New Conventional
Purchase Details
Closed on
May 11, 2006
Sold by
Smith Smith W and Smith Maylene
Bought by
Chmiel Katherine S and Chmiel Paul N
Purchase Details
Closed on
Feb 27, 1998
Sold by
Smith W Ritchie
Bought by
Smith Smith W and Smith Maylene
Create a Home Valuation Report for This Property
The Home Valuation Report is an in-depth analysis detailing your home's value as well as a comparison with similar homes in the area
Home Values in the Area
Average Home Value in this Area
Purchase History
| Date | Buyer | Sale Price | Title Company |
|---|---|---|---|
| Rocha Jose A | $255,000 | Mcangus Goudelock & Courie Llc | |
| Chmiel Tuyet Lisa Ly | $150,000 | Savage Royall & Sheheen Llp | |
| Chmiel Katherine S | $133,000 | -- | |
| Smith Smith W | -- | -- |
Source: Public Records
Mortgage History
| Date | Status | Borrower | Loan Amount |
|---|---|---|---|
| Open | Rocha Jose A | $264,180 | |
| Previous Owner | Chmiel Tuyet Lisa Ly | $100,000 |
Source: Public Records
Tax History Compared to Growth
Tax History
| Year | Tax Paid | Tax Assessment Tax Assessment Total Assessment is a certain percentage of the fair market value that is determined by local assessors to be the total taxable value of land and additions on the property. | Land | Improvement |
|---|---|---|---|---|
| 2024 | $6,059 | $266,600 | $38,000 | $228,600 |
| 2023 | $2,683 | $255,000 | $38,000 | $217,000 |
| 2022 | $3,233 | $255,000 | $38,000 | $217,000 |
| 2021 | $852 | $146,700 | $25,000 | $121,700 |
| 2020 | $827 | $125,900 | $18,500 | $107,400 |
| 2019 | $854 | $125,900 | $18,500 | $107,400 |
| 2018 | $863 | $125,900 | $18,500 | $107,400 |
| 2017 | $810 | $125,900 | $18,500 | $107,400 |
| 2016 | $783 | $121,900 | $16,500 | $105,400 |
| 2015 | $573 | $121,900 | $16,500 | $105,400 |
| 2014 | $573 | $4,876 | $0 | $0 |
Source: Public Records
Map
Nearby Homes
- 1807 Forest Dr
- 1916 Forest Dr
- 1929 Brook Dr
- 22 Shoal Ct
- 170 Carriagebrook Cir
- 142 Carriagebrook Cir
- 2009 S Brailsford Rd
- 1958 Forest Dr
- 9 Legacy Ct
- 1951 Forest Dr
- 2106 Davie Ln
- 2108 Davie Ln
- 108 Hackamore Ln
- 2236 Carter St Unit Tract D
- 2224 Carter St Unit Tract C
- 8 Pinetop Rd
- 1201 Laurens St
- 1821 Campbell St
- 1010 Laurens St
- 319 Ballfield Rd