Estimated Value: $243,703 - $292,000
3
Beds
3
Baths
2,198
Sq Ft
$121/Sq Ft
Est. Value
About This Home
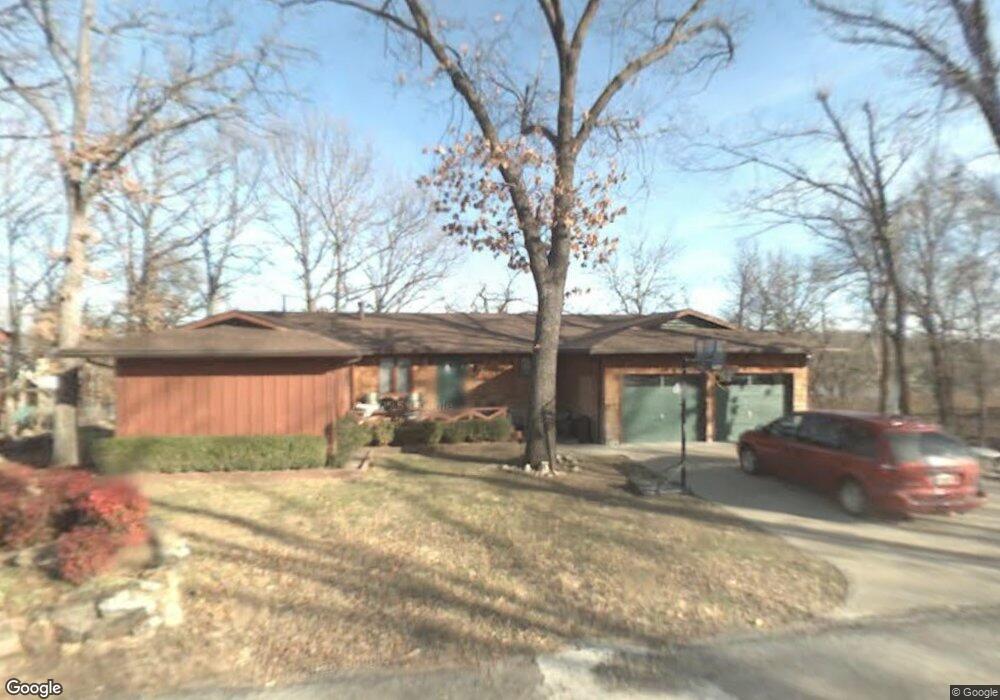
This home is located at 1711 Hebbert St, Grove, OK 74344 and is currently estimated at $266,926, approximately $121 per square foot. 1711 Hebbert St is a home located in Delaware County with nearby schools including Grove Lower Elementary School, Grove Upper Elementary School, and Grove Middle School.
Ownership History
Date
Name
Owned For
Owner Type
Purchase Details
Closed on
Dec 9, 2022
Sold by
Yanez Jose M and Yanez Karen
Bought by
Yanez Jose M and Bernardy Karen
Current Estimated Value
Home Financials for this Owner
Home Financials are based on the most recent Mortgage that was taken out on this home.
Original Mortgage
$180,000
Outstanding Balance
$170,389
Interest Rate
4%
Mortgage Type
VA
Estimated Equity
$96,537
Purchase Details
Closed on
Sep 22, 2020
Sold by
Stattel Paul A and The Stattel Family Living Trus
Bought by
Yanez Jose M and Bernarti Karen
Home Financials for this Owner
Home Financials are based on the most recent Mortgage that was taken out on this home.
Original Mortgage
$165,000
Interest Rate
2.9%
Mortgage Type
VA
Purchase Details
Closed on
Jan 21, 2016
Sold by
Stattel Paul A and Stattel Paula S
Bought by
Stattel Paul A and Stattel Paula Suzanne
Create a Home Valuation Report for This Property
The Home Valuation Report is an in-depth analysis detailing your home's value as well as a comparison with similar homes in the area
Home Values in the Area
Average Home Value in this Area
Purchase History
| Date | Buyer | Sale Price | Title Company |
|---|---|---|---|
| Yanez Jose M | -- | -- | |
| Yanez Jose M | $165,000 | Apex Title Northeast Ok Llc | |
| Stattel Paul A | -- | None Available |
Source: Public Records
Mortgage History
| Date | Status | Borrower | Loan Amount |
|---|---|---|---|
| Open | Yanez Jose M | $180,000 | |
| Previous Owner | Yanez Jose M | $165,000 |
Source: Public Records
Tax History
| Year | Tax Paid | Tax Assessment Tax Assessment Total Assessment is a certain percentage of the fair market value that is determined by local assessors to be the total taxable value of land and additions on the property. | Land | Improvement |
|---|---|---|---|---|
| 2025 | -- | $20,927 | $2,026 | $18,901 |
| 2024 | -- | $20,317 | $1,967 | $18,350 |
| 2023 | $0 | $19,725 | $1,895 | $17,830 |
| 2022 | $0 | $19,726 | $1,875 | $17,851 |
| 2021 | $1,549 | $18,594 | $1,875 | $16,719 |
| 2020 | $1,016 | $16,116 | $1,875 | $14,241 |
| 2019 | $987 | $12,610 | $1,792 | $10,818 |
| 2018 | $954 | $12,610 | $1,793 | $10,817 |
| 2017 | $927 | $12,243 | $1,783 | $10,460 |
| 2016 | $897 | $11,540 | $1,760 | $9,780 |
| 2015 | $910 | $11,540 | $1,760 | $9,780 |
| 2014 | $900 | $11,375 | $1,725 | $9,650 |
Source: Public Records
Map
Nearby Homes
- 1307 W 16th St
- 1621 Rockwood Dr
- 1616 Battle Dr
- 1301 Maple Dr
- 1305 Dubois
- 1709 Cardiac Cove Rd
- 1202 Woodcrest Way
- 1429 Wood St
- 1425 Wood St
- 1128 Rolling Oaks Rd
- 1019 S Sycamore
- 1119 Rolling Oaks Rd
- 61113 E 310 Rd
- 2668 Shasten St
- 2666 Shasten St
- 31797 S 598 Ct
- TBD Leisure Ln
- 0 Baycrest Ave
- 2850 Harber Oaks Loop
- 131 Cozy
- 1710 Manna Dr Grove
- 1710 Marina Dr
- 1712 Hebbert St
- 1709 Hebbert St
- 1117 Dogwood Dr
- 1706 Marina Dr
- 0 (Vacant Land) Hebbert St
- 1710 Hebbert St
- 1119 Dogwood Dr
- 1110 Dogwwod Ln
- 1113 Dogwwod Dr
- 1113 Dogwood Dr
- 1716 Hebbert St
- 1301 Herbert
- 1718 Hebbert St
- 1114 Dogwood Dr
- 1116 Dogwood Dr
- 1109 Dogwood Dr
- 1706 Dogwood Ln
- 1110 Dogwood Dr
Your Personal Tour Guide
Ask me questions while you tour the home.