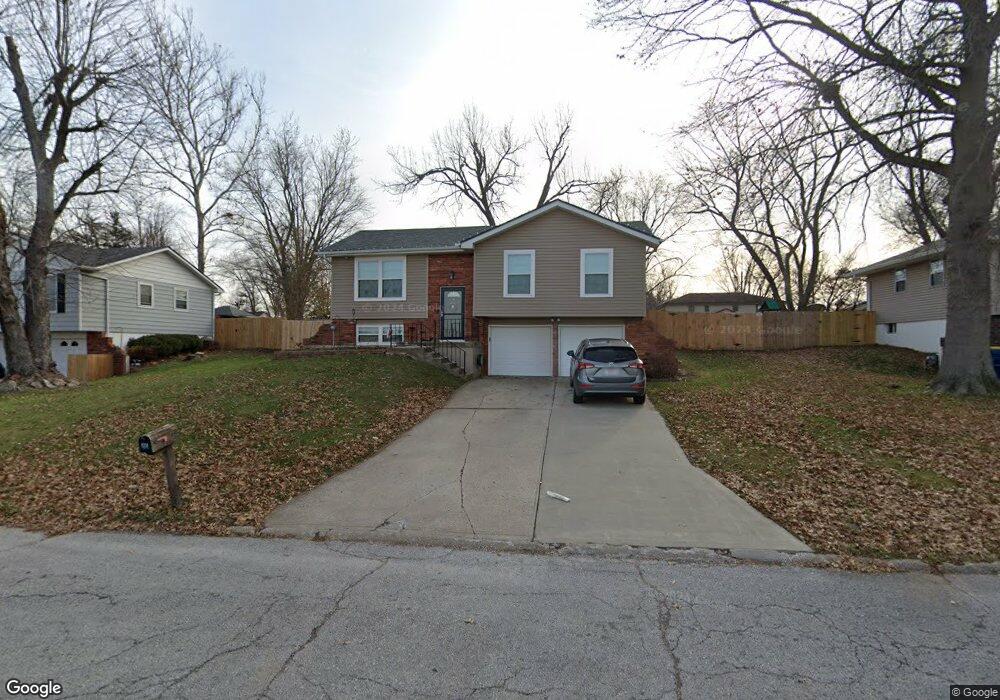
1711 Karlton Way Excelsior Springs, MO 64024
Estimated Value: $221,000 - $240,000
3
Beds
2
Baths
1,000
Sq Ft
$233/Sq Ft
Est. Value
About This Home
This home is located at 1711 Karlton Way, Excelsior Springs, MO 64024 and is currently estimated at $232,835, approximately $232 per square foot. 1711 Karlton Way is a home located in Clay County with nearby schools including Excelsior Springs High School.
Ownership History
Date
Name
Owned For
Owner Type
Purchase Details
Closed on
Mar 15, 2001
Sold by
Firstar Bank Na
Bought by
Fowler Gary W and Fowler Tara M
Current Estimated Value
Home Financials for this Owner
Home Financials are based on the most recent Mortgage that was taken out on this home.
Original Mortgage
$91,000
Outstanding Balance
$32,551
Interest Rate
6.95%
Estimated Equity
$200,284
Purchase Details
Closed on
Feb 8, 2001
Sold by
Jones Doug E and Jones Glenda J
Bought by
Firstar Bank Na
Home Financials for this Owner
Home Financials are based on the most recent Mortgage that was taken out on this home.
Original Mortgage
$91,000
Outstanding Balance
$32,551
Interest Rate
6.95%
Estimated Equity
$200,284
Purchase Details
Closed on
Mar 25, 1998
Sold by
Rash Aaron D and Rash Lorrie A
Bought by
Jones Douglas E and Jones Glenda J
Home Financials for this Owner
Home Financials are based on the most recent Mortgage that was taken out on this home.
Original Mortgage
$79,541
Interest Rate
7.12%
Mortgage Type
FHA
Create a Home Valuation Report for This Property
The Home Valuation Report is an in-depth analysis detailing your home's value as well as a comparison with similar homes in the area
Home Values in the Area
Average Home Value in this Area
Purchase History
| Date | Buyer | Sale Price | Title Company |
|---|---|---|---|
| Fowler Gary W | -- | Security Land Title Company | |
| Firstar Bank Na | $84,536 | First American Title Ins Co | |
| Jones Douglas E | -- | -- |
Source: Public Records
Mortgage History
| Date | Status | Borrower | Loan Amount |
|---|---|---|---|
| Open | Fowler Gary W | $91,000 | |
| Previous Owner | Jones Douglas E | $79,541 |
Source: Public Records
Tax History Compared to Growth
Tax History
| Year | Tax Paid | Tax Assessment Tax Assessment Total Assessment is a certain percentage of the fair market value that is determined by local assessors to be the total taxable value of land and additions on the property. | Land | Improvement |
|---|---|---|---|---|
| 2025 | $1,981 | $31,430 | -- | -- |
| 2024 | $1,981 | $28,250 | -- | -- |
| 2023 | $1,924 | $27,610 | $0 | $0 |
| 2022 | $1,737 | $24,510 | $0 | $0 |
| 2021 | $1,743 | $24,510 | $3,800 | $20,710 |
| 2020 | $1,464 | $20,010 | $0 | $0 |
| 2019 | $1,463 | $20,007 | $3,420 | $16,587 |
| 2018 | $1,315 | $17,940 | $0 | $0 |
| 2017 | $1,283 | $17,940 | $3,420 | $14,520 |
| 2016 | $1,283 | $17,940 | $3,420 | $14,520 |
| 2015 | $1,295 | $17,940 | $3,420 | $14,520 |
| 2014 | $1,258 | $17,270 | $3,420 | $13,850 |
Source: Public Records
Map
Nearby Homes
- 2017 Wornall Rd
- Lot 2 Wornall Rd
- 1904 Karlton Way
- 617 Lodwick Ln
- 1908 Lesa Place
- 609 Kimberly Dr
- 2017 Karlton Way
- 125 Crown Hill Rd
- 00000 NE 144th St
- 2081 Rock Bridge Pkwy
- 402 Leslie Ln
- 1318 Kristie Cir
- 240 Rock Bridge Pkwy
- 2021 Riverstone Dr
- 402 Greenspire St
- 304 Waller Ave
- 106 Helen St
- 332 Woods Ave
- 2207 Ashford St
- 1101 Williams St
- 1709 Karlton Way
- 1713 Karlton Way
- 1712 Wornall Rd
- 1710 Wornall Rd
- 1714 Wornall Rd
- 1715 Karlton Way
- 1716 Wornall Rd
- 1706 Wornall Rd
- 1717 Karlton Way
- 1718 Wornall Rd
- 0 Wornall Rd Unit 2115413
- 0 Wornall Rd Unit 1882351
- 0 Wornall Rd Unit 2054211
- 0 Wornall Rd Unit 2217939
- 0 Wornall Rd Unit 2138058
- 1719 Karlton Way
- 1715 Wornall Rd
- 1704 Wornall Rd
- 1720 Wornall Rd
- 601 Zay Dr