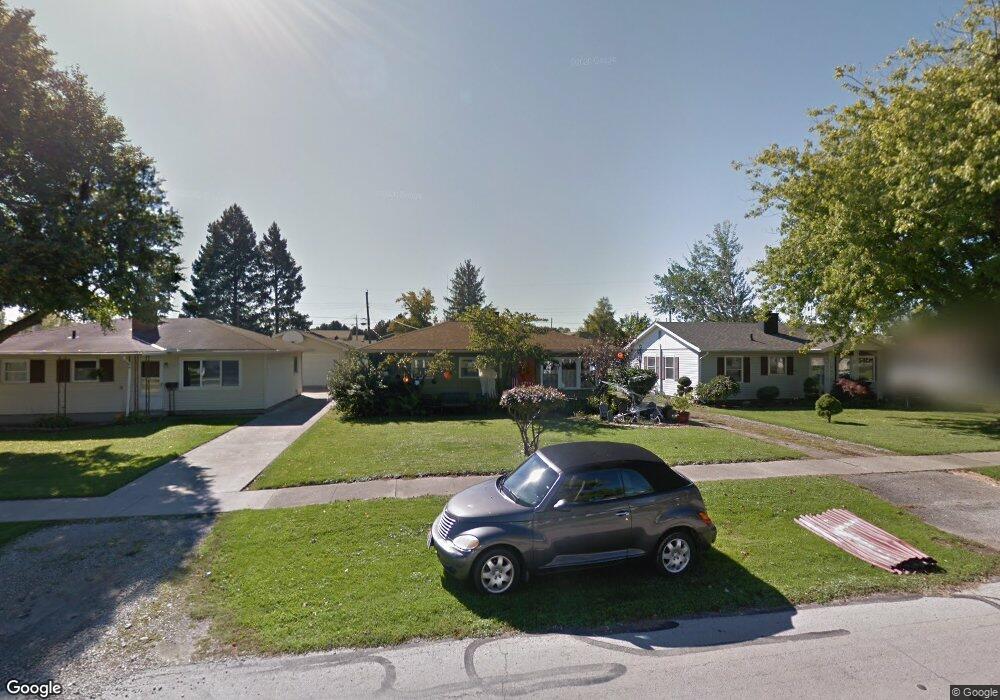
1711 North St Fremont, OH 43420
Estimated Value: $100,632 - $120,000
3
Beds
1
Bath
925
Sq Ft
$120/Sq Ft
Est. Value
About This Home
This home is located at 1711 North St, Fremont, OH 43420 and is currently estimated at $110,658, approximately $119 per square foot. 1711 North St is a home located in Sandusky County with nearby schools including Fremont Ross High School, St. Ann Catholic School, and St. Joseph School.
Ownership History
Date
Name
Owned For
Owner Type
Purchase Details
Closed on
May 18, 2011
Sold by
Ashcraft Thomas Judson and Ashcraft Lisa
Bought by
Ashcraft Nancy
Current Estimated Value
Purchase Details
Closed on
Jan 20, 2011
Sold by
Estate Of Jacquelyn Ashcraft
Bought by
Ashcraft Thomas Judson and Sanchez Martha Imler
Create a Home Valuation Report for This Property
The Home Valuation Report is an in-depth analysis detailing your home's value as well as a comparison with similar homes in the area
Home Values in the Area
Average Home Value in this Area
Purchase History
| Date | Buyer | Sale Price | Title Company |
|---|---|---|---|
| Ashcraft Nancy | -- | Attorney | |
| Ashcraft Thomas Judson | -- | None Available |
Source: Public Records
Tax History Compared to Growth
Tax History
| Year | Tax Paid | Tax Assessment Tax Assessment Total Assessment is a certain percentage of the fair market value that is determined by local assessors to be the total taxable value of land and additions on the property. | Land | Improvement |
|---|---|---|---|---|
| 2024 | $876 | $23,740 | $5,710 | $18,030 |
| 2023 | $876 | $18,240 | $4,380 | $13,860 |
| 2022 | $708 | $18,240 | $4,380 | $13,860 |
| 2021 | $731 | $18,240 | $4,380 | $13,860 |
| 2020 | $738 | $18,140 | $4,380 | $13,760 |
| 2019 | $737 | $18,140 | $4,380 | $13,760 |
| 2018 | $725 | $18,140 | $4,380 | $13,760 |
| 2017 | $713 | $17,470 | $4,380 | $13,090 |
| 2016 | $625 | $17,470 | $4,380 | $13,090 |
| 2015 | $615 | $17,470 | $4,380 | $13,090 |
| 2014 | $643 | $17,430 | $4,270 | $13,160 |
| 2013 | $629 | $17,430 | $4,270 | $13,160 |
Source: Public Records
Map
Nearby Homes