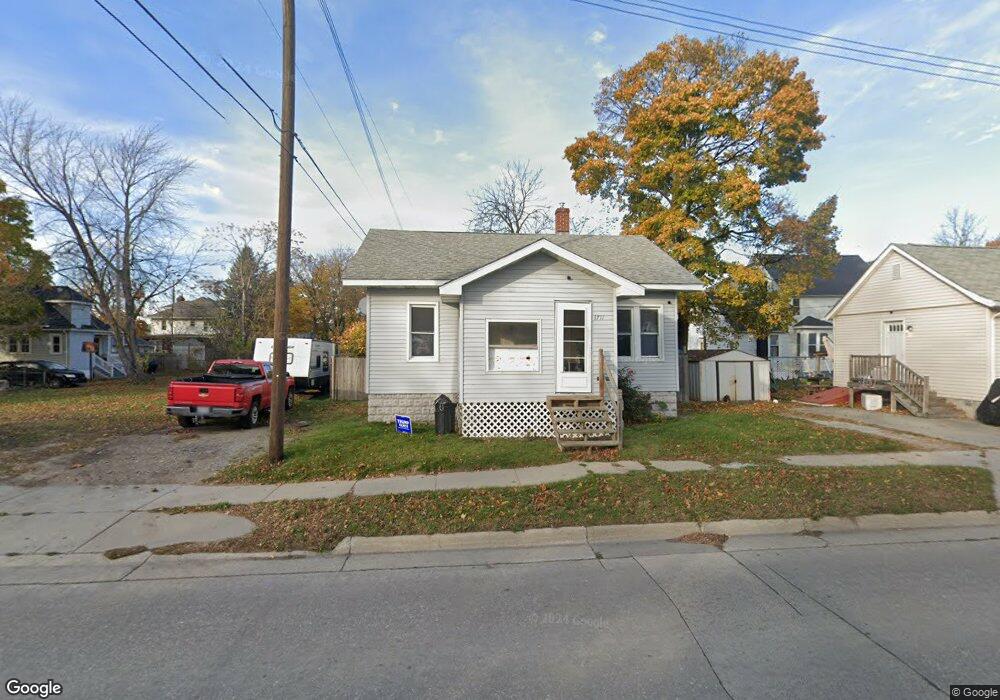
1711 Oak St Port Huron, MI 48060
Estimated Value: $74,967 - $120,000
2
Beds
1
Bath
768
Sq Ft
$125/Sq Ft
Est. Value
About This Home
This home is located at 1711 Oak St, Port Huron, MI 48060 and is currently estimated at $96,242, approximately $125 per square foot. 1711 Oak St is a home located in St. Clair County with nearby schools including Michigamme Elementary School, Central Middle School, and Port Huron High School.
Ownership History
Date
Name
Owned For
Owner Type
Purchase Details
Closed on
Jun 3, 2016
Sold by
Port Huron Neighborhood Housing Corporat
Bought by
Henn Julie and Henn Evan
Current Estimated Value
Purchase Details
Closed on
Feb 26, 2015
Sold by
Nb Management Investments 1 Llc
Bought by
Henn Evan and Henn Julie
Purchase Details
Closed on
Sep 17, 2013
Sold by
Roberts Burnett Kelly
Bought by
Nb Management Investment 1 Llc
Purchase Details
Closed on
Jan 8, 2013
Sold by
Federal Home Loan Mortgage Corporatio
Bought by
Harris George
Create a Home Valuation Report for This Property
The Home Valuation Report is an in-depth analysis detailing your home's value as well as a comparison with similar homes in the area
Home Values in the Area
Average Home Value in this Area
Purchase History
| Date | Buyer | Sale Price | Title Company |
|---|---|---|---|
| Henn Julie | -- | None Available | |
| Henn Evan | $30,000 | First American Title | |
| Henn Ewan | -- | First American Title Ins Co | |
| Nb Management Investment 1 Llc | $13,000 | None Available | |
| Harris George | $11,000 | -- |
Source: Public Records
Tax History Compared to Growth
Tax History
| Year | Tax Paid | Tax Assessment Tax Assessment Total Assessment is a certain percentage of the fair market value that is determined by local assessors to be the total taxable value of land and additions on the property. | Land | Improvement |
|---|---|---|---|---|
| 2025 | $152 | $37,300 | $0 | $0 |
| 2024 | $971 | $37,300 | $0 | $0 |
| 2023 | $764 | $33,200 | $0 | $0 |
| 2022 | $723 | $27,700 | $0 | $0 |
| 2021 | $1,417 | $24,100 | $0 | $0 |
| 2020 | $695 | $21,100 | $21,100 | $0 |
| 2019 | $683 | $14,800 | $0 | $0 |
| 2018 | $668 | $14,800 | $0 | $0 |
| 2017 | $598 | $13,900 | $0 | $0 |
| 2016 | $498 | $13,900 | $0 | $0 |
| 2015 | $781 | $14,000 | $14,000 | $0 |
| 2014 | $781 | $14,500 | $14,500 | $0 |
| 2013 | -- | $16,200 | $0 | $0 |
Source: Public Records
Map
Nearby Homes