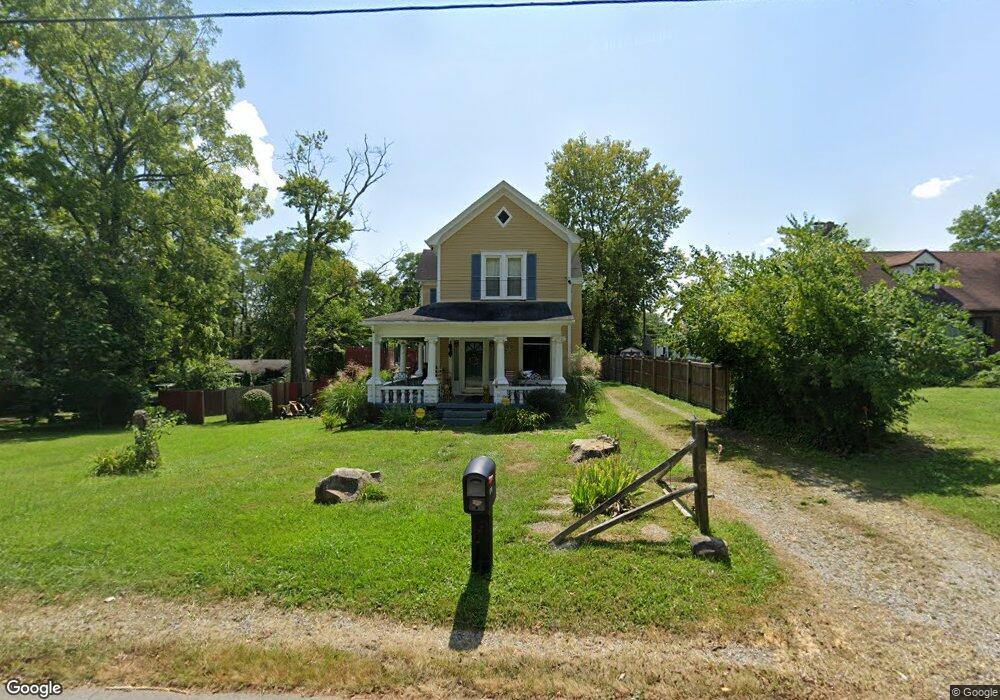
1711 S E St Richmond, IN 47374
Estimated Value: $112,000 - $224,000
4
Beds
3
Baths
1,872
Sq Ft
$86/Sq Ft
Est. Value
About This Home
This home is located at 1711 S E St, Richmond, IN 47374 and is currently estimated at $160,685, approximately $85 per square foot. 1711 S E St is a home located in Wayne County with nearby schools including Charles Elementary School, Julia E. Test Intermediate School, and Richmond High School.
Ownership History
Date
Name
Owned For
Owner Type
Purchase Details
Closed on
May 14, 2019
Sold by
Crowder Elaine G
Bought by
Crowder Brad L
Current Estimated Value
Purchase Details
Closed on
May 1, 2007
Sold by
Crowder Brad L
Bought by
Crowder Brad Lee and Crowder Elaine G
Home Financials for this Owner
Home Financials are based on the most recent Mortgage that was taken out on this home.
Original Mortgage
$37,777
Interest Rate
6.2%
Mortgage Type
Stand Alone Second
Purchase Details
Closed on
Apr 19, 2007
Sold by
Jackson Alphonso
Bought by
Crowder Brad L
Home Financials for this Owner
Home Financials are based on the most recent Mortgage that was taken out on this home.
Original Mortgage
$37,777
Interest Rate
6.2%
Mortgage Type
Stand Alone Second
Purchase Details
Closed on
Apr 18, 2006
Sold by
Mulder Shannon D
Bought by
Midfirst Bank
Purchase Details
Closed on
Aug 30, 2004
Sold by
Midfirst Bank
Bought by
Secreatary Of Hud
Create a Home Valuation Report for This Property
The Home Valuation Report is an in-depth analysis detailing your home's value as well as a comparison with similar homes in the area
Home Values in the Area
Average Home Value in this Area
Purchase History
| Date | Buyer | Sale Price | Title Company |
|---|---|---|---|
| Crowder Brad L | -- | -- | |
| Crowder Brad Lee | -- | -- | |
| Crowder Brad L | -- | -- | |
| Midfirst Bank | $109,449 | -- | |
| Secreatary Of Hud | -- | -- |
Source: Public Records
Mortgage History
| Date | Status | Borrower | Loan Amount |
|---|---|---|---|
| Previous Owner | Crowder Brad L | $37,777 |
Source: Public Records
Tax History Compared to Growth
Tax History
| Year | Tax Paid | Tax Assessment Tax Assessment Total Assessment is a certain percentage of the fair market value that is determined by local assessors to be the total taxable value of land and additions on the property. | Land | Improvement |
|---|---|---|---|---|
| 2024 | $500 | $50,000 | $18,400 | $31,600 |
| 2023 | $641 | $64,100 | $16,100 | $48,000 |
| 2022 | $346 | $42,500 | $15,700 | $26,800 |
| 2021 | $356 | $42,500 | $15,700 | $26,800 |
| 2020 | $338 | $42,500 | $15,700 | $26,800 |
| 2019 | $306 | $44,400 | $15,700 | $28,700 |
| 2018 | $331 | $44,400 | $15,700 | $28,700 |
| 2017 | $329 | $44,400 | $15,700 | $28,700 |
| 2016 | $323 | $44,500 | $15,700 | $28,800 |
| 2014 | $281 | $44,200 | $19,700 | $24,500 |
| 2013 | $281 | $53,700 | $19,700 | $34,000 |
Source: Public Records
Map
Nearby Homes