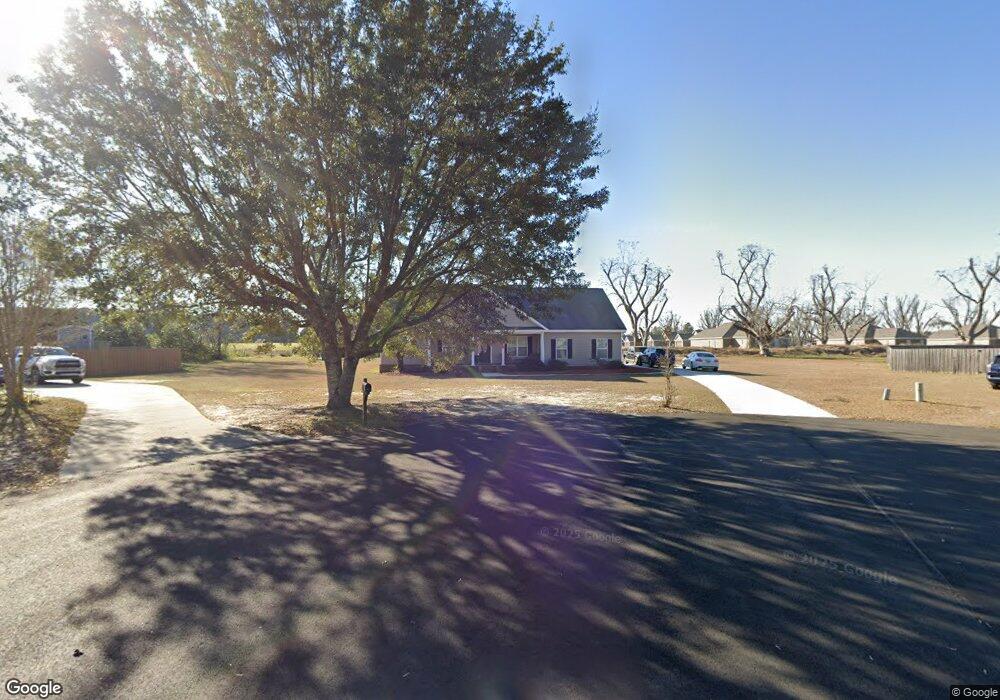
1711 Scarlett Place Brooklet, GA 30415
Estimated Value: $310,400 - $324,000
4
Beds
2
Baths
1,690
Sq Ft
$190/Sq Ft
Est. Value
About This Home
This home is located at 1711 Scarlett Place, Brooklet, GA 30415 and is currently estimated at $320,600, approximately $189 per square foot. 1711 Scarlett Place is a home located in Bulloch County with nearby schools including Brooklet Elementary School, Southeast Bulloch High School, and Southeast Bulloch Middle School.
Ownership History
Date
Name
Owned For
Owner Type
Purchase Details
Closed on
May 26, 2011
Sold by
First Southern National Bank
Bought by
Anderson Carl A
Current Estimated Value
Home Financials for this Owner
Home Financials are based on the most recent Mortgage that was taken out on this home.
Original Mortgage
$144,337
Outstanding Balance
$100,247
Interest Rate
4.79%
Mortgage Type
VA
Estimated Equity
$220,353
Purchase Details
Closed on
Jul 6, 2010
Sold by
Davis Paul D
Bought by
First Southern National Bank
Purchase Details
Closed on
May 11, 2007
Sold by
Not Provided
Bought by
Anderson Carl A and Anderson Tabitha A
Purchase Details
Closed on
Dec 22, 2005
Bought by
Cindot Construction Inc
Purchase Details
Closed on
Aug 10, 2005
Bought by
Marlowe Richard L
Purchase Details
Closed on
Feb 20, 2004
Bought by
Scott Scott and Scott Scott
Create a Home Valuation Report for This Property
The Home Valuation Report is an in-depth analysis detailing your home's value as well as a comparison with similar homes in the area
Home Values in the Area
Average Home Value in this Area
Purchase History
| Date | Buyer | Sale Price | Title Company |
|---|---|---|---|
| Anderson Carl A | $141,300 | -- | |
| First Southern National Bank | -- | -- | |
| Anderson Carl A | $35,000 | -- | |
| Cindot Construction Inc | -- | -- | |
| Marlowe Richard L | -- | -- | |
| Scott Scott | -- | -- |
Source: Public Records
Mortgage History
| Date | Status | Borrower | Loan Amount |
|---|---|---|---|
| Open | First Southern National Bank | $144,337 |
Source: Public Records
Tax History Compared to Growth
Tax History
| Year | Tax Paid | Tax Assessment Tax Assessment Total Assessment is a certain percentage of the fair market value that is determined by local assessors to be the total taxable value of land and additions on the property. | Land | Improvement |
|---|---|---|---|---|
| 2024 | -- | $109,080 | $18,000 | $91,080 |
| 2023 | $2,307 | $94,840 | $14,000 | $80,840 |
| 2022 | $1,638 | $75,892 | $9,400 | $66,492 |
| 2021 | $1,444 | $65,232 | $9,400 | $55,832 |
| 2020 | $1,424 | $62,684 | $9,400 | $53,284 |
| 2019 | $1,452 | $63,550 | $10,720 | $52,830 |
| 2018 | $1,414 | $62,531 | $10,720 | $51,811 |
| 2017 | $1,383 | $60,384 | $10,720 | $49,664 |
| 2016 | $1,380 | $58,729 | $10,720 | $48,009 |
| 2015 | $1,368 | $57,958 | $10,720 | $47,238 |
| 2014 | $1,261 | $57,958 | $10,720 | $47,238 |
Source: Public Records
Map
Nearby Homes
- 1705 Scarlett Place
- 129 Orchard Way Unit LOT 15
- 127 Orchard Way Unit LOT 14
- 129 Orchard Way
- 131 Orchard Way
- 127 Orchard Way
- 131 Orchard Way Unit LOT 16
- 0 Old Leefield Rd Unit 10626397
- 10143 U S 80
- 713 W Lane St
- 0 E Highway 80 Hwy Unit 10490324
- 893 W Lane St
- 1805 Nottingham Rd
- 207 Dixie St
- 209 Elm St
- 616 Pinewood Dr
- 1603 Lennox Rd
- 305 Treasure Blvd
- 10544 Burkhalter Rd
- 731 Ogeechee Dr E
- 1709 Scarlett Place
- 18624 U S 80
- 1710 Scarlett Place
- 1708 Scarlett Place
- 1707 Scarlett Place
- 1806 Rhett Ct
- 1706 Scarlett Place
- 1613 Colony Ln
- 1611 Colony Ln
- 1804 Rhett Ct
- 0 Scarlett Place Unit 18 7049657
- 1807 Rhett Ct
- 1615 Colony Ln Unit 9
- 1615 Colony Ln
- 1607 Colony Ln Unit 9/18/200
- 1607 Colony Ln
- 0 Colony Ln Unit LOT 9 7049643
- 0 Colony Ln Unit 9 8054442
- 0 Rhett Ct Unit LOT 34 7143845
- 0 Rhett Ct Unit 30 8603988