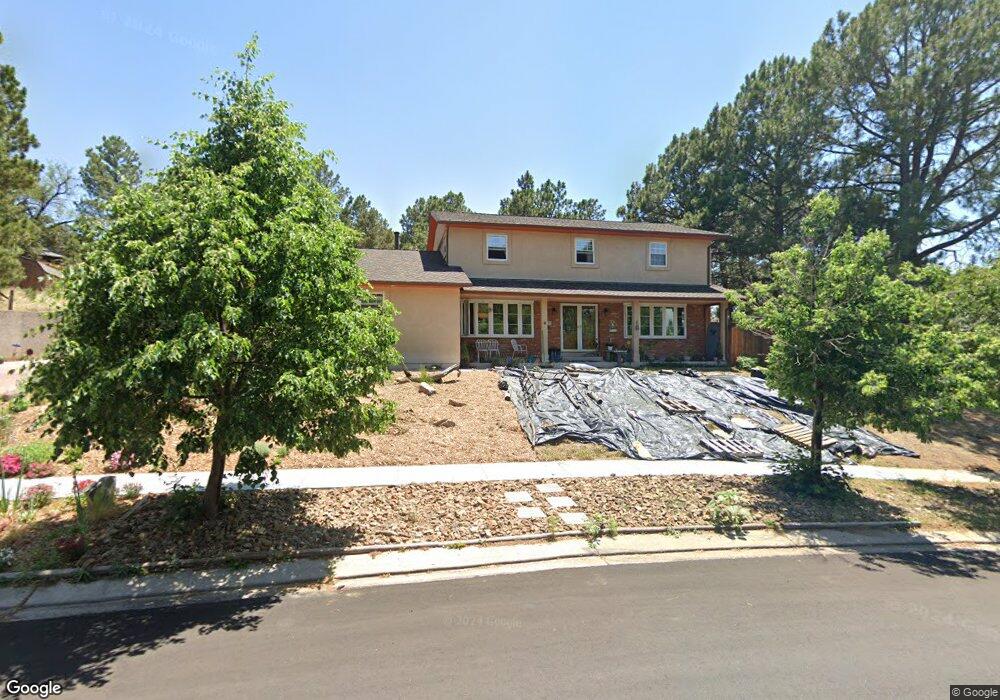
1711 van Diest Rd Colorado Springs, CO 80915
Rustic Hills NeighborhoodEstimated Value: $528,000 - $679,000
5
Beds
4
Baths
2,436
Sq Ft
$243/Sq Ft
Est. Value
About This Home
This home is located at 1711 van Diest Rd, Colorado Springs, CO 80915 and is currently estimated at $592,366, approximately $243 per square foot. 1711 van Diest Rd is a home located in El Paso County with nearby schools including Henry Elementary School, Jack Swigert Aerospace Academy, and Mitchell High School.
Ownership History
Date
Name
Owned For
Owner Type
Purchase Details
Closed on
Jun 26, 2015
Sold by
Rostollan Jacob J and Rostollan Kathryn A
Bought by
Stull Tamara and Coddington Brett
Current Estimated Value
Home Financials for this Owner
Home Financials are based on the most recent Mortgage that was taken out on this home.
Original Mortgage
$279,000
Outstanding Balance
$217,927
Interest Rate
3.91%
Mortgage Type
New Conventional
Estimated Equity
$374,439
Purchase Details
Closed on
Feb 28, 2013
Sold by
Denning Kenneth R and Denning Susan
Bought by
Rostollan Jacob J and Rostollan Kathryn A
Home Financials for this Owner
Home Financials are based on the most recent Mortgage that was taken out on this home.
Original Mortgage
$228,500
Interest Rate
3.43%
Mortgage Type
New Conventional
Purchase Details
Closed on
Jun 1, 1985
Bought by
Stull Tamara
Purchase Details
Closed on
Sep 1, 1978
Bought by
Stull Tamara
Create a Home Valuation Report for This Property
The Home Valuation Report is an in-depth analysis detailing your home's value as well as a comparison with similar homes in the area
Home Values in the Area
Average Home Value in this Area
Purchase History
| Date | Buyer | Sale Price | Title Company |
|---|---|---|---|
| Stull Tamara | $300,000 | Empire Title Co Springs Llc | |
| Rostollan Jacob J | $286,500 | Fidelity National Title Insu | |
| Stull Tamara | -- | -- | |
| Stull Tamara | -- | -- |
Source: Public Records
Mortgage History
| Date | Status | Borrower | Loan Amount |
|---|---|---|---|
| Open | Stull Tamara | $279,000 | |
| Previous Owner | Rostollan Jacob J | $228,500 |
Source: Public Records
Tax History Compared to Growth
Tax History
| Year | Tax Paid | Tax Assessment Tax Assessment Total Assessment is a certain percentage of the fair market value that is determined by local assessors to be the total taxable value of land and additions on the property. | Land | Improvement |
|---|---|---|---|---|
| 2025 | $1,893 | $37,730 | -- | -- |
| 2024 | $1,775 | $38,530 | $7,480 | $31,050 |
| 2023 | $1,775 | $38,530 | $7,480 | $31,050 |
| 2022 | $1,693 | $30,250 | $6,000 | $24,250 |
| 2021 | $1,836 | $31,120 | $6,180 | $24,940 |
| 2020 | $1,980 | $29,180 | $5,410 | $23,770 |
| 2019 | $1,970 | $29,180 | $5,410 | $23,770 |
| 2018 | $1,885 | $25,690 | $4,280 | $21,410 |
| 2017 | $1,785 | $25,690 | $4,280 | $21,410 |
| 2016 | $1,413 | $24,380 | $4,160 | $20,220 |
| 2015 | $1,408 | $24,380 | $4,160 | $20,220 |
| 2014 | $1,411 | $23,440 | $4,160 | $19,280 |
Source: Public Records
Map
Nearby Homes
- 1717 van Diest Rd
- 1735 Wooten Rd
- 5345 Heather Ridge Ct
- 5509 Timeless View
- 1921 Wooten Rd
- 5375 Babcock Ct
- 1914 Wooten Rd
- 5014 Palmer Park Blvd
- 1518 Sanderson Ave
- 5330 Silver Spur Ave
- 5007 Palmer Park Blvd
- 2065 Crystal River Dr
- 5410 Dawnridge Dr
- 1501 E Owen Cir
- 1508 E Owen Cir
- 5320 Saddle Horn Ave
- 1770 Sawyer Way
- 1202 Wooten Rd
- 1216 Osgood Rd
- 5102 Galley Rd Unit 520AE
- 1633 Babcock Ln
- 1705 van Diest Rd
- 1634 Babcock Ln
- 1631 Babcock Ln
- 1710 van Diest Rd
- 1722 van Diest Rd
- 1723 van Diest Rd
- 1625 Sanderson Ave
- 1704 van Diest Rd
- 1632 Babcock Ln
- 1629 Babcock Ln
- 1621 Sanderson Ave
- 1727 van Diest Rd
- 1730 van Diest Rd
- 1630 Babcock Ln
- 1711 Sanderson Ave
- 1615 Lehmberg Blvd
- 1720 Kimberly Place
- 1626 Sanderson Ave
- 1630 Sanderson Ave