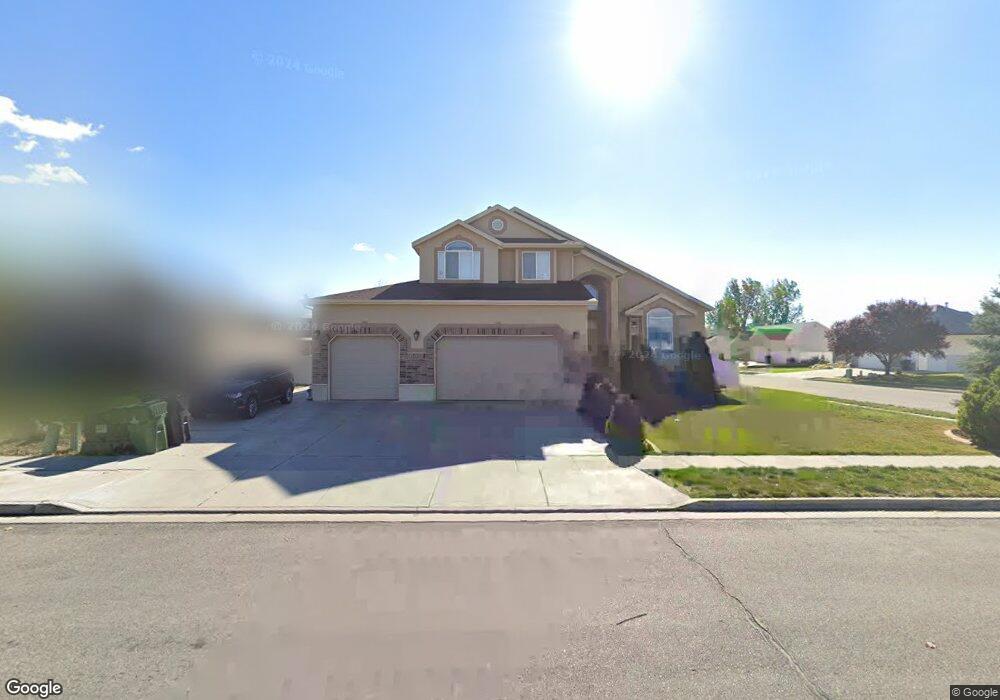
1711 W 2055 S Syracuse, UT 84075
Estimated Value: $599,000 - $638,000
5
Beds
4
Baths
3,110
Sq Ft
$200/Sq Ft
Est. Value
About This Home
This home is located at 1711 W 2055 S, Syracuse, UT 84075 and is currently estimated at $623,422, approximately $200 per square foot. 1711 W 2055 S is a home located in Davis County with nearby schools including Cook School, Syracuse Junior High School, and Syracuse High School.
Ownership History
Date
Name
Owned For
Owner Type
Purchase Details
Closed on
Jul 18, 2019
Sold by
Burke Angela D and Burke Thomas G
Bought by
Garong Samantha Lynn and Garong Arjay
Current Estimated Value
Home Financials for this Owner
Home Financials are based on the most recent Mortgage that was taken out on this home.
Original Mortgage
$392,755
Outstanding Balance
$341,786
Interest Rate
3.5%
Mortgage Type
FHA
Estimated Equity
$281,636
Purchase Details
Closed on
Feb 16, 2005
Sold by
Mike Schultz Construction Inc
Bought by
Bradfield Troy and Bradfield Lisa
Home Financials for this Owner
Home Financials are based on the most recent Mortgage that was taken out on this home.
Original Mortgage
$215,163
Interest Rate
6.62%
Mortgage Type
Adjustable Rate Mortgage/ARM
Create a Home Valuation Report for This Property
The Home Valuation Report is an in-depth analysis detailing your home's value as well as a comparison with similar homes in the area
Home Values in the Area
Average Home Value in this Area
Purchase History
| Date | Buyer | Sale Price | Title Company |
|---|---|---|---|
| Garong Samantha Lynn | -- | Metro National Title | |
| Bradfield Troy | -- | Heritage West Title Ins Agen |
Source: Public Records
Mortgage History
| Date | Status | Borrower | Loan Amount |
|---|---|---|---|
| Open | Garong Samantha Lynn | $392,755 | |
| Previous Owner | Bradfield Troy | $215,163 |
Source: Public Records
Tax History Compared to Growth
Tax History
| Year | Tax Paid | Tax Assessment Tax Assessment Total Assessment is a certain percentage of the fair market value that is determined by local assessors to be the total taxable value of land and additions on the property. | Land | Improvement |
|---|---|---|---|---|
| 2025 | $3,432 | $331,100 | $117,521 | $213,579 |
| 2024 | $3,227 | $313,500 | $96,072 | $217,428 |
| 2023 | $3,006 | $532,000 | $133,929 | $398,071 |
| 2022 | $3,282 | $318,450 | $77,249 | $241,201 |
| 2021 | $2,983 | $448,000 | $114,029 | $333,971 |
| 2020 | $2,682 | $390,000 | $99,897 | $290,103 |
| 2019 | $2,605 | $374,000 | $96,954 | $277,046 |
| 2018 | $2,407 | $343,000 | $94,007 | $248,993 |
| 2016 | $2,139 | $159,831 | $36,108 | $123,723 |
| 2015 | $1,893 | $134,696 | $36,108 | $98,588 |
| 2014 | $1,781 | $129,185 | $36,108 | $93,077 |
| 2013 | -- | $117,616 | $32,571 | $85,045 |
Source: Public Records
Map
Nearby Homes