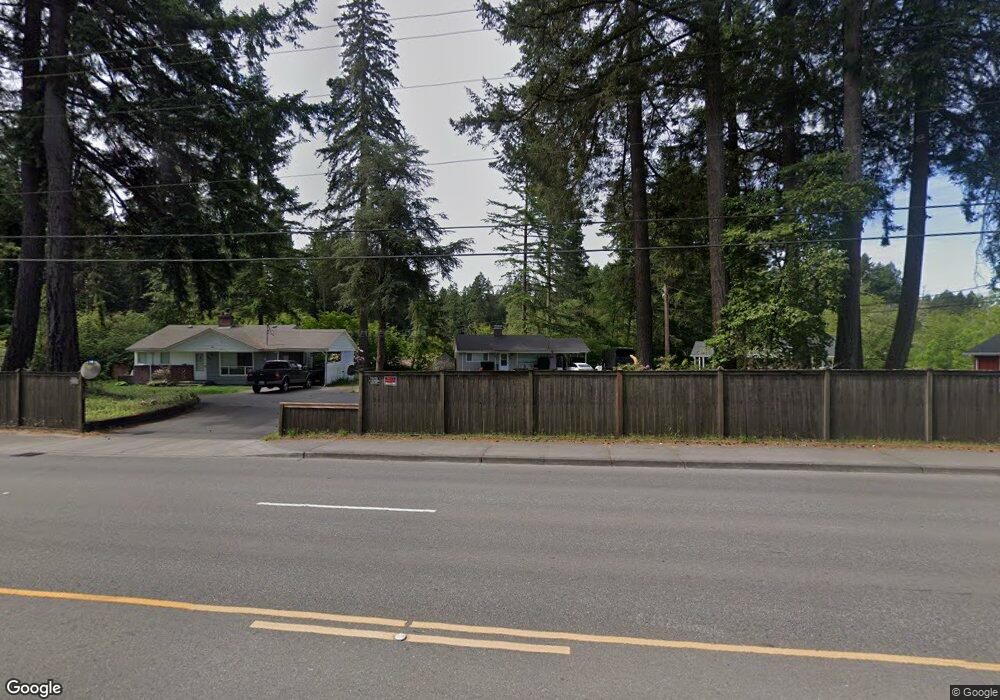
17112 Spanaway Loop Rd S Spanaway, WA 98387
Estimated Value: $511,000 - $1,017,000
8
Beds
4
Baths
3,328
Sq Ft
$233/Sq Ft
Est. Value
About This Home
This home is located at 17112 Spanaway Loop Rd S, Spanaway, WA 98387 and is currently estimated at $775,568, approximately $233 per square foot. 17112 Spanaway Loop Rd S is a home located in Pierce County with nearby schools including Spanaway Elementary School, Spanaway Middle School, and Spanaway Lake High School.
Ownership History
Date
Name
Owned For
Owner Type
Purchase Details
Closed on
Jan 28, 2010
Sold by
Stucke Joy Alayne
Bought by
Stucke Joy Alayne and Living Trust Of Joy Alayne Stucke
Current Estimated Value
Purchase Details
Closed on
Jan 24, 2003
Sold by
Kist John
Bought by
Sutton Lyman B and Stucke Joy
Home Financials for this Owner
Home Financials are based on the most recent Mortgage that was taken out on this home.
Original Mortgage
$249,375
Outstanding Balance
$104,368
Interest Rate
5.76%
Mortgage Type
Seller Take Back
Estimated Equity
$671,200
Purchase Details
Closed on
Nov 23, 1993
Sold by
Hamilton Thomas J
Bought by
Kist John and Kist Charlotte
Home Financials for this Owner
Home Financials are based on the most recent Mortgage that was taken out on this home.
Original Mortgage
$91,203
Interest Rate
6.85%
Create a Home Valuation Report for This Property
The Home Valuation Report is an in-depth analysis detailing your home's value as well as a comparison with similar homes in the area
Home Values in the Area
Average Home Value in this Area
Purchase History
| Date | Buyer | Sale Price | Title Company |
|---|---|---|---|
| Stucke Joy Alayne | -- | None Available | |
| Sutton Lyman B | $332,500 | Fidelity National Title Co | |
| Kist John | -- | -- |
Source: Public Records
Mortgage History
| Date | Status | Borrower | Loan Amount |
|---|---|---|---|
| Open | Sutton Lyman B | $249,375 | |
| Previous Owner | Kist John | $91,203 |
Source: Public Records
Tax History
| Year | Tax Paid | Tax Assessment Tax Assessment Total Assessment is a certain percentage of the fair market value that is determined by local assessors to be the total taxable value of land and additions on the property. | Land | Improvement |
|---|---|---|---|---|
| 2025 | $8,875 | $722,900 | $273,600 | $449,300 |
| 2024 | $8,875 | $717,000 | $261,000 | $456,000 |
| 2023 | $8,875 | $738,800 | $259,900 | $478,900 |
| 2022 | $8,720 | $751,800 | $259,900 | $491,900 |
| 2021 | $8,392 | $580,600 | $158,600 | $422,000 |
| 2019 | $6,168 | $533,900 | $134,500 | $399,400 |
| 2018 | $6,885 | $490,900 | $120,600 | $370,300 |
| 2017 | $6,077 | $429,200 | $101,100 | $328,100 |
| 2016 | $5,413 | $332,300 | $77,000 | $255,300 |
| 2014 | $4,740 | $308,700 | $75,900 | $232,800 |
| 2013 | $4,740 | $282,200 | $66,400 | $215,800 |
Source: Public Records
Map
Nearby Homes
- 17303 Spanaway Loop Rd S Unit 26
- 17303 Spanaway Loop Rd S Unit 47
- 17303 Spanaway Loop Rd S Unit 2
- 17303 Spanaway Loop Rd S Unit 18
- 17303 Spanaway Loop Rd S
- 17303 Spanaway Loop Rd S Unit 49
- 17303 Spanaway Loop Rd S Unit 27
- 17303 Spanaway Loop Rd S Unit 4
- 17103 Spanaway Loop Rd S Unit 15
- 17103 Spanaway Loop Rd S Unit 22
- 625 173rd St S
- 1207 Creso Rd S
- 627 166th St S
- 17519 Park Ave S
- 1906 164th St S
- 237 167th St S
- 16011 Spanaway Loop Rd S
- 16006 Spanaway Loop Rd S
- 426 160th St S
- 17302 A St S
- 17112 Avenue Ct S
- 1730 Spanaway Loop Rd Unit 49
- 17102 S Spanaway Rd Loop S
- 17110 Spanaway Loop Rd S
- 17108 Spanaway Loop Rd S
- 17006 Spanaway Rd Loop
- 17103 Spanaway Rd Loop S Unit 37
- 17103 Spanaway Rd Loop S Unit 4
- 17103 Spanaway Rd Loop S Unit 18
- 17106 Spanaway Loop Rd S
- 17303 Spanaway Loop Rd S Unit 28
- 17303 Spanaway Loop Rd S Unit 22
- 17303 Spanaway Loop Rd S Unit 53
- 17303 Spanaway Loop Rd S Unit 13
- 17303 Spanaway Loop Rd S Unit 11
- 17303 Spanaway Loop Rd S Unit 7
- 17303 Spanaway Loop Rd S Unit 14
- 17303 Spanaway Loop Rd S Unit 25
Your Personal Tour Guide
Ask me questions while you tour the home.