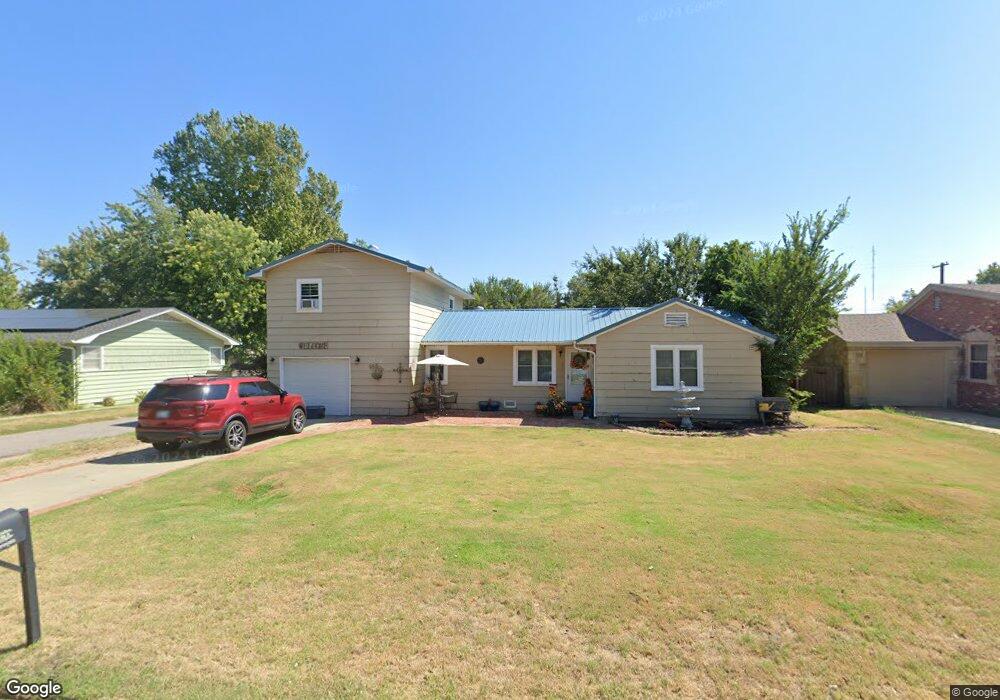
1712 18th St Woodward, OK 73801
Estimated Value: $71,000 - $116,000
3
Beds
2
Baths
1,239
Sq Ft
$74/Sq Ft
Est. Value
About This Home
This home is located at 1712 18th St, Woodward, OK 73801 and is currently estimated at $91,978, approximately $74 per square foot. 1712 18th St is a home located in Woodward County with nearby schools including Woodward High School and Woodward Christian Academy.
Ownership History
Date
Name
Owned For
Owner Type
Purchase Details
Closed on
Oct 16, 2024
Sold by
Pierce David Allen and Pierce Amelia M
Bought by
Taylor Scherrie
Current Estimated Value
Home Financials for this Owner
Home Financials are based on the most recent Mortgage that was taken out on this home.
Original Mortgage
$63,822
Outstanding Balance
$63,151
Interest Rate
6.35%
Mortgage Type
FHA
Estimated Equity
$28,827
Purchase Details
Closed on
May 28, 2004
Bought by
Pierce David Allen and Pierce Amelia M
Create a Home Valuation Report for This Property
The Home Valuation Report is an in-depth analysis detailing your home's value as well as a comparison with similar homes in the area
Home Values in the Area
Average Home Value in this Area
Purchase History
| Date | Buyer | Sale Price | Title Company |
|---|---|---|---|
| Taylor Scherrie | $65,000 | First American Title Insurance | |
| Pierce David Allen | $72,000 | -- |
Source: Public Records
Mortgage History
| Date | Status | Borrower | Loan Amount |
|---|---|---|---|
| Open | Taylor Scherrie | $63,822 |
Source: Public Records
Tax History Compared to Growth
Tax History
| Year | Tax Paid | Tax Assessment Tax Assessment Total Assessment is a certain percentage of the fair market value that is determined by local assessors to be the total taxable value of land and additions on the property. | Land | Improvement |
|---|---|---|---|---|
| 2024 | $858 | $9,409 | $1,173 | $8,236 |
| 2023 | $817 | $8,961 | $1,173 | $7,788 |
| 2022 | $793 | $8,534 | $1,173 | $7,361 |
| 2021 | $968 | $10,708 | $905 | $9,803 |
| 2020 | $929 | $10,199 | $845 | $9,354 |
| 2019 | $867 | $9,712 | $787 | $8,925 |
| 2018 | $839 | $9,250 | $789 | $8,461 |
| 2017 | $790 | $8,810 | $806 | $8,004 |
| 2016 | $763 | $8,390 | $1,056 | $7,334 |
| 2015 | $734 | $8,390 | $1,056 | $7,334 |
| 2014 | $699 | $7,991 | $869 | $7,122 |
Source: Public Records
Map
Nearby Homes