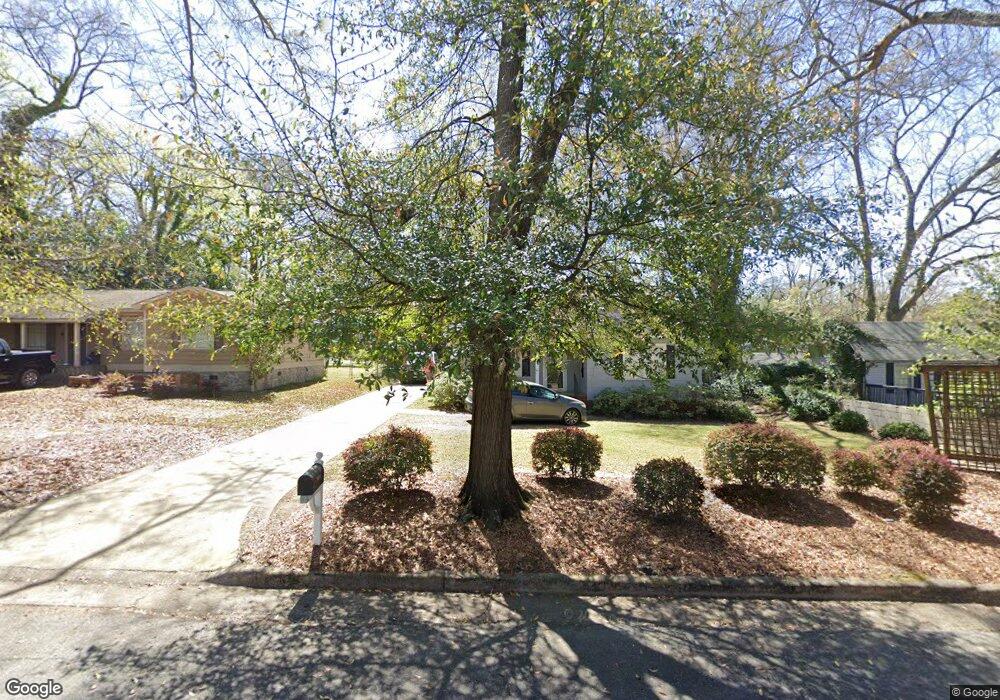
1712 43rd St Columbus, GA 31904
Northern Columbus NeighborhoodEstimated Value: $87,000 - $105,665
2
Beds
2
Baths
1,058
Sq Ft
$88/Sq Ft
Est. Value
About This Home
This home is located at 1712 43rd St, Columbus, GA 31904 and is currently estimated at $93,166, approximately $88 per square foot. 1712 43rd St is a home located in Muscogee County with nearby schools including Johnson Elementary School, Richards Middle School, and Jordan Vocational High School.
Ownership History
Date
Name
Owned For
Owner Type
Purchase Details
Closed on
Sep 16, 2024
Sold by
Tyler Edward M and Tyler Cheryl L
Bought by
Berends Joshua and Berends Nelleka
Current Estimated Value
Home Financials for this Owner
Home Financials are based on the most recent Mortgage that was taken out on this home.
Original Mortgage
$80,995
Outstanding Balance
$80,128
Interest Rate
6.73%
Mortgage Type
New Conventional
Estimated Equity
$13,038
Purchase Details
Closed on
Jun 28, 2018
Sold by
Tyler Edward M
Bought by
Tyler Edward M and Tyler Cheryl L
Purchase Details
Closed on
Apr 3, 2018
Sold by
Jpmorgan Chase Bank
Bought by
Secretary Of Veterans Affairs
Create a Home Valuation Report for This Property
The Home Valuation Report is an in-depth analysis detailing your home's value as well as a comparison with similar homes in the area
Home Values in the Area
Average Home Value in this Area
Purchase History
| Date | Buyer | Sale Price | Title Company |
|---|---|---|---|
| Berends Joshua | $83,500 | None Listed On Document | |
| Tyler Edward M | -- | -- | |
| Tyler Edward M | $50,000 | -- | |
| Secretary Of Veterans Affairs | $49,539 | -- | |
| Jpmorgan Chase Bank Na | $54,452 | -- |
Source: Public Records
Mortgage History
| Date | Status | Borrower | Loan Amount |
|---|---|---|---|
| Open | Berends Joshua | $80,995 |
Source: Public Records
Tax History Compared to Growth
Tax History
| Year | Tax Paid | Tax Assessment Tax Assessment Total Assessment is a certain percentage of the fair market value that is determined by local assessors to be the total taxable value of land and additions on the property. | Land | Improvement |
|---|---|---|---|---|
| 2025 | $192 | $49,056 | $7,896 | $41,160 |
| 2024 | $1,635 | $41,768 | $7,896 | $33,872 |
| 2023 | $1,645 | $41,768 | $7,896 | $33,872 |
| 2022 | $1,384 | $33,892 | $7,896 | $25,996 |
| 2021 | $1,291 | $31,628 | $7,896 | $23,732 |
| 2020 | $1,292 | $31,628 | $7,896 | $23,732 |
| 2019 | $819 | $20,000 | $5,200 | $14,800 |
| 2018 | $611 | $29,764 | $7,896 | $21,868 |
| 2017 | $614 | $29,764 | $7,896 | $21,868 |
| 2016 | $618 | $28,253 | $3,102 | $25,151 |
| 2015 | $619 | $28,253 | $3,102 | $25,151 |
| 2014 | $621 | $28,253 | $3,102 | $25,151 |
| 2013 | -- | $28,253 | $3,102 | $25,151 |
Source: Public Records
Map
Nearby Homes
- 1717 42nd St
- 4220 18th Ave
- 4109 Sherwood Ave
- 4213 16th Ave
- 1702 40th St
- 2012 42nd St
- 1703 39th St
- 3905 Crestview Dr
- 2122 40th St
- 1918 Rosemont Dr
- 4714 18th Ave
- 3643 Calvin Dr
- 2206 Devonshire Dr
- 4830 17th Ave
- 4214 Saint Francis Ave Unit A
- 4814 20th Ave
- 0 Warm Springs Rd
- 2323 Devonshire Dr
- 2257 Camille Dr
- 3305 Cherokee Ave