1712 50th St Kenosha, WI 53140
Washington NeighborhoodEstimated Value: $193,000 - $292,808
3
Beds
1
Bath
1,176
Sq Ft
$198/Sq Ft
Est. Value
About This Home
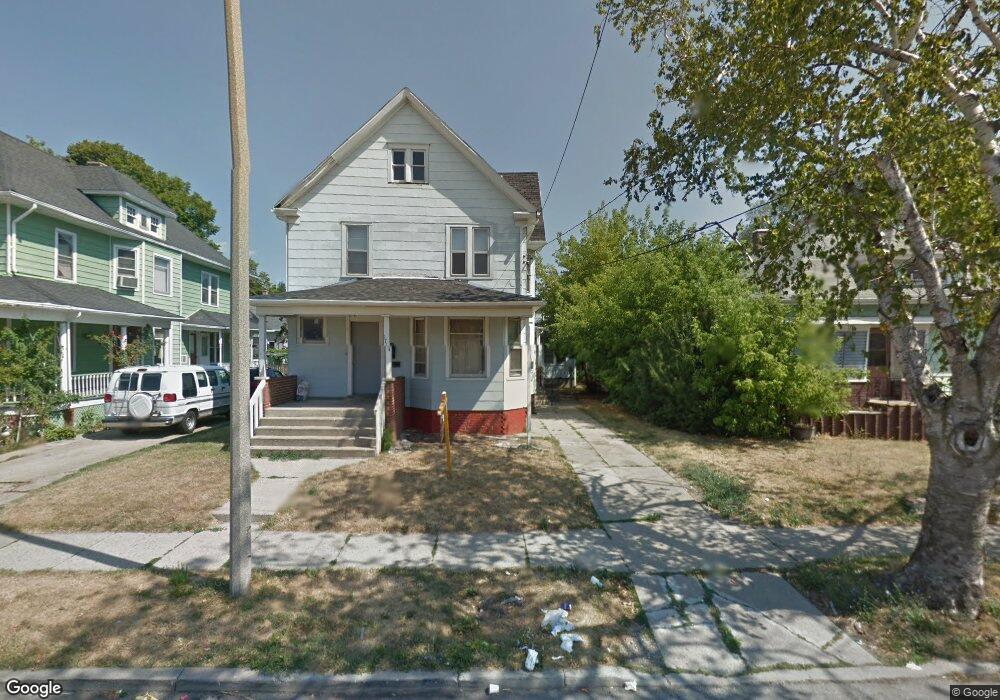
This home is located at 1712 50th St, Kenosha, WI 53140 and is currently estimated at $232,603, approximately $197 per square foot. 1712 50th St is a home located in Kenosha County with nearby schools including Jefferson Elementary School, Washington Middle School, and Bradford High School.
Ownership History
Date
Name
Owned For
Owner Type
Purchase Details
Closed on
Aug 23, 2018
Sold by
Kenosha County Clerk
Bought by
Kenosha City
Current Estimated Value
Purchase Details
Closed on
Aug 3, 2018
Sold by
Kenosha County Clerk
Bought by
Gatti Ryan
Purchase Details
Closed on
Oct 30, 2013
Sold by
Federal Deposit Insurance Corporation
Bought by
Gatti Ryan
Purchase Details
Closed on
Oct 22, 2010
Sold by
Superior Estates Llc
Bought by
Banks Of Wisconsin
Purchase Details
Closed on
Aug 15, 2005
Sold by
Fani Frank and Fani Frank
Bought by
Superior Estates Llc
Home Financials for this Owner
Home Financials are based on the most recent Mortgage that was taken out on this home.
Original Mortgage
$128,000
Interest Rate
5.82%
Mortgage Type
Purchase Money Mortgage
Create a Home Valuation Report for This Property
The Home Valuation Report is an in-depth analysis detailing your home's value as well as a comparison with similar homes in the area
Home Values in the Area
Average Home Value in this Area
Purchase History
| Date | Buyer | Sale Price | Title Company |
|---|---|---|---|
| Kenosha City | -- | None Available | |
| Gatti Ryan | -- | None Available | |
| Gatti Ryan | $26,400 | -- | |
| Banks Of Wisconsin | $90,000 | -- | |
| Superior Estates Llc | $159,900 | None Available |
Source: Public Records
Mortgage History
| Date | Status | Borrower | Loan Amount |
|---|---|---|---|
| Previous Owner | Superior Estates Llc | $128,000 | |
| Closed | Gatti Ryan | $0 |
Source: Public Records
Tax History Compared to Growth
Tax History
| Year | Tax Paid | Tax Assessment Tax Assessment Total Assessment is a certain percentage of the fair market value that is determined by local assessors to be the total taxable value of land and additions on the property. | Land | Improvement |
|---|---|---|---|---|
| 2024 | -- | $0 | $0 | $0 |
| 2023 | $0 | $0 | $0 | $0 |
| 2022 | $0 | $0 | $0 | $0 |
| 2021 | $0 | $0 | $0 | $0 |
| 2020 | $0 | $0 | $0 | $0 |
| 2019 | $3,529 | $0 | $0 | $0 |
| 2018 | $4,321 | $92,400 | $16,200 | $76,200 |
| 2017 | $5,933 | $92,400 | $16,200 | $76,200 |
| 2016 | $4,278 | $92,400 | $16,200 | $76,200 |
| 2015 | $3,890 | $91,600 | $20,200 | $71,400 |
| 2014 | $4,703 | $91,600 | $20,200 | $71,400 |
Source: Public Records
Map
Nearby Homes